Global Battery Manufacturing Landscape
Overview – Battery Types and Applications
Lead acid
Properties: High specific power, low cost, and reliability.
Applications: Primary application in invertors and used as auxiliary power source in vehicle startup.
Energy Density – 25 to 35 Wh/kg.
Sodium ion
Properties: High Energy density, cheap cost and high availability of raw material.
Applications: It is an evolving technology and currently startups have come up with pilot projects for mobility and storage sector.
Energy Density-50-60 Wh/kg
Lithium-ion
Properties: Low maintenance, high efficiency batteries.
Application: Toys, mobiles and other electronic goods. In recent times, EVs and stationary storage primarily use Li-ion batteries.
Energy Density-90 to 220 Wh/kg
Lithium-ion : NMC vs LFP
LFP is a lower cost and more stable chemistry, with lower risk of catching fire and a longer cycle life. Energy Density: 90-120 Wh/kg
NMC offer high energy density based on higher nickel content in the cathode. Higher nickel content, however, requires more complex and controlled production processes. Energy Density: 150-220 Wh/kg
Applications of Lithium-ion Battery
Automotive (mobility) sector
- •Batteries are recognized as a key enabling technology for the energy transition.
- •In past few years lithium batteries have evolved as a major transforming technology in E-mobility sector.
- •Lithium batteries are lightweight , have a longer life span, and have a low self-discharge rate compared to lead acid batteries.
Non- Automotive sector
- Telecom Tower companies are adopting LiBs to minimize diesel use amid economic and environmental pressures.
- With the ongoing pace of RE capacity addition in India, the scope for LiB-based grid-scale storage continues to widen to resolve the intermittent RE supply and fulfill the growing energy demand
- In light of restrictive measures by many state-run utilities on net-metering and electricity banking in the grid, there are increasing opportunities for LiBs based rooftop solar-plus-BESS market.
- The increasing use of LiBs in smartphones, laptops, and elsewhere is driving LiB growth across the globe.
Global Battery Manufacturing Landscape – Lithium-ion Battery Demand
China, European Union and the United States collectively accounted for nearly 90% of the capacity added in 2023, amounting to 43GWh in the stationary storage segment.
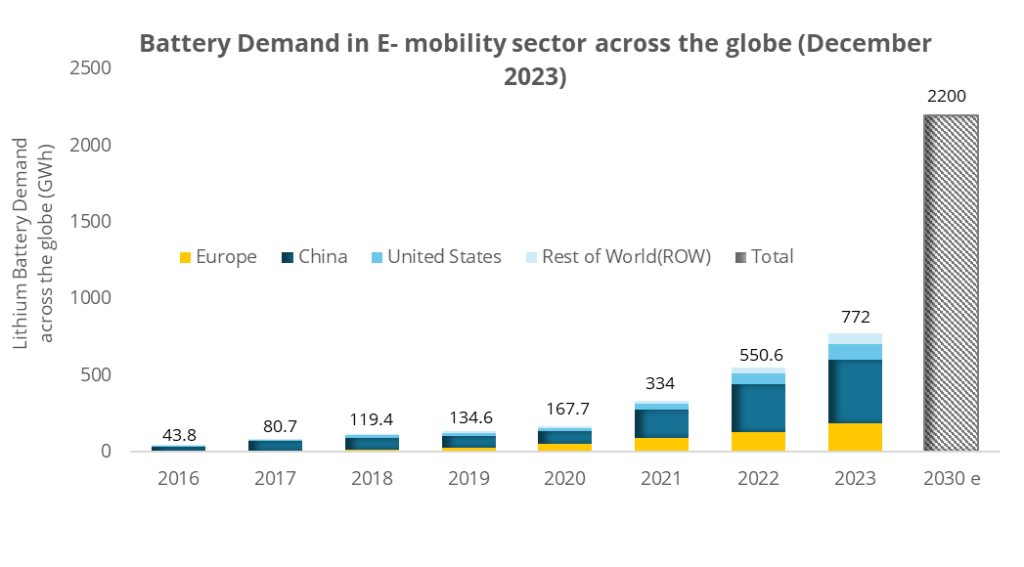
It is anticipated that the Lithium battery demand in E-mobility sector will be ~4 times in CY 2030 compared to CY 2022
- •As the global demand for cleaner energy solutions escalates, lithium-ion batteries have swiftly risen to prominence.
- •The global demand for lithium-ion batteries has increased fourfold from 2019 to 2023, reaching ~865 GWh.
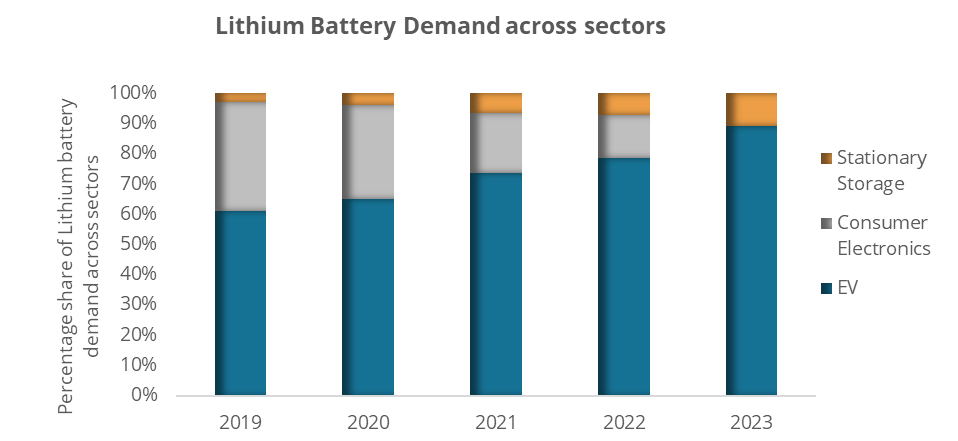
- •In the last four years, the lithium battery demand for the EV sector has increased by ~ 5 times primarily due to growth in EV adoption. •Concurrently, the lithium battery demand in stationary storage has surged by approximately ninefold, primarily attributed to the widespread adoption of lithium batteries in energy sector.
- •In the country-wise distribution for lithium-ion battery, China holds a share of 54% followed by Europe and US with 24% and 13%, respectively in 2023.
- •Lithium-ion battery demand has gained substantial momentum globally in segments like light duty vehicles including cars and vans.
- •The share of light duty vehicles has increased from 51% to 93%. Corresponding to an increase from 22.3 GWh in 2016 to ~710 GWh in 2023. As per the International Energy Agency (IEA) , it is anticipated that the demand for batteries will grow to 2200 GWh by 2030 for E-mobility sector.
Global Battery Manufacturing Landscape- Battery Manufacturing Supply Chain
China holds a substantial share i.e. >80% in the downstream global EV supply chain.
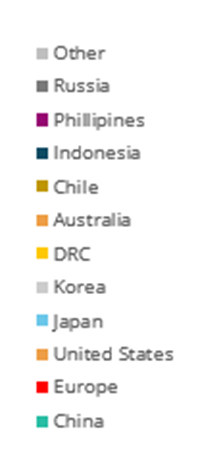
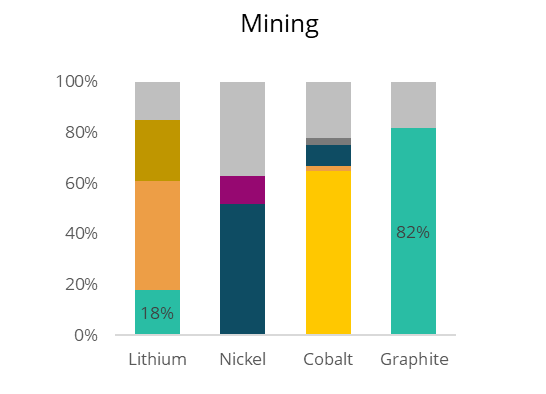
- •The key raw materials for lithium battery manufacturing are diversely distributed across various geographical locations. As of 2023,the majority of lithium reserves, accounting for 43% of the global reserves, are situated in Australia. Indonesia holds the majority share of nickel reserves at 52%, while the Democratic Republic of Congo boasts 65% of cobalt reserves and China holds a share of 82% of Graphite.
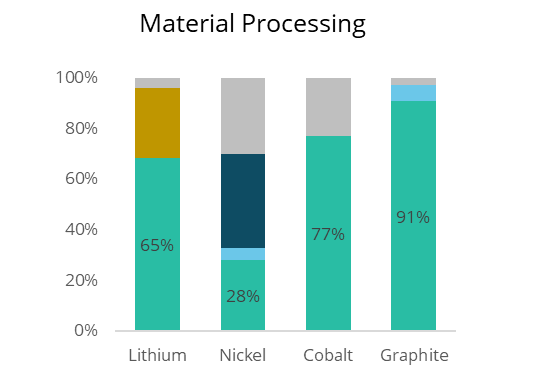
- •Lithium-ion battery manufacturing involves three key stages: manufacturing of cell elements i.e. anode, cathode, electrolyte, separator followed by assembly of cell components and arranging cells in series to form a battery.
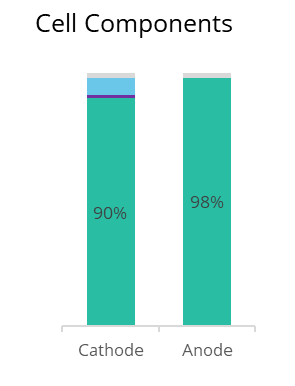
- •As of 2023, China holds monopoly with over 90% of cathode and anode manufacturing capacity. •As of 2023 China held a share of 85% in battery cell production followed by Europe and US with 8% and 5% share, respectively .
- •In 2023 China’s cumulative cell production capacity was more than double the amount needed to meet the country’s battery cell demand.
Global Battery Manufacturing Landscape – China
It is anticipated that the US, Europe and China will hold more than 90% of the global lithium manufacturing capacity in 2030
Chinese Lithium battery production increased by ~6 times from 2019-2023
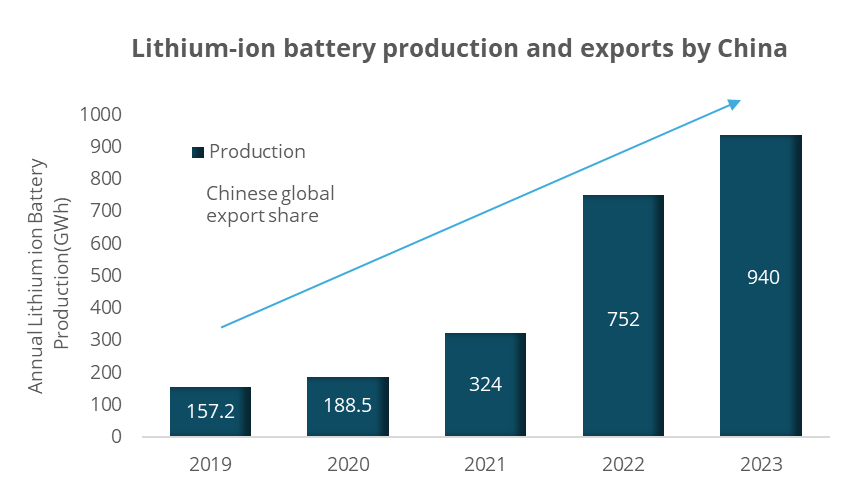
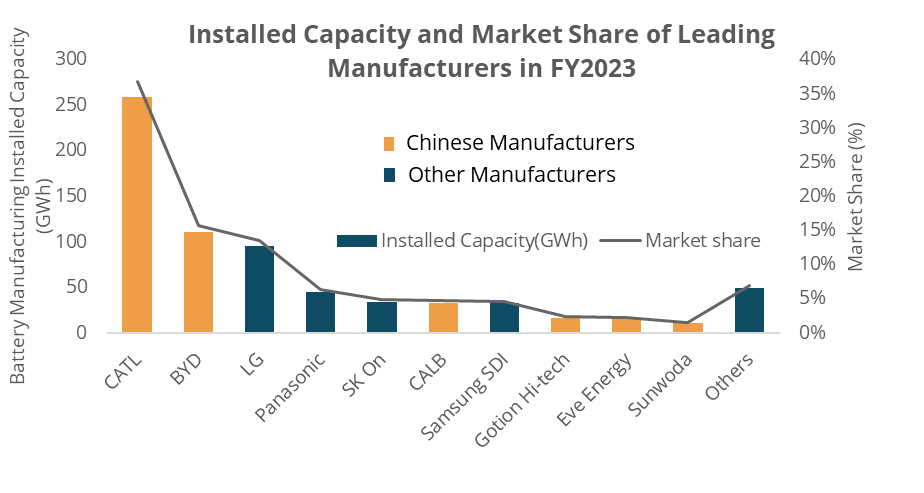
The global EV Battery consumption was 705.5 GWh in FY2023 in which leading Chinese players hold ~63% market share . CATL, a Chinese manufacturer has a battery manufacturing installed capacity of 259.7 GWh with a market share of 37% as of December 2023.
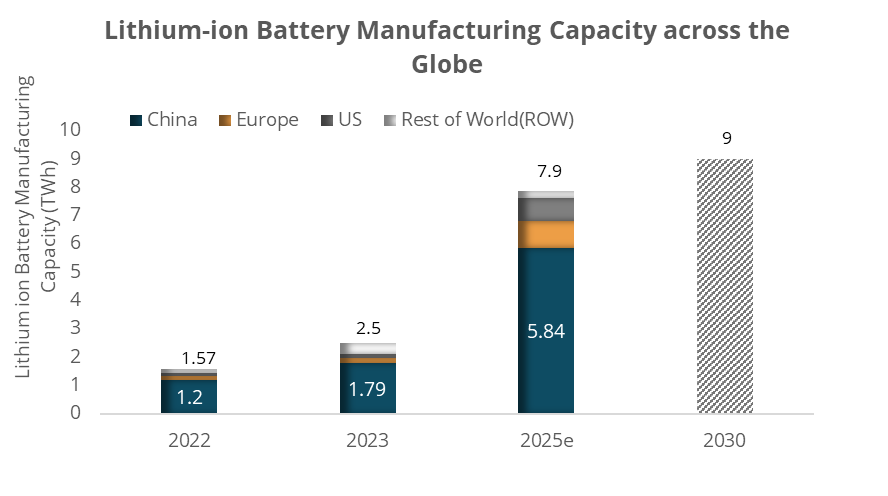
- Global Lithium Battery manufacturing capacity stands at 1.57 TWh, and China holds a share of 76.43%.
- •The global manufacturing capacity has increased to 2.5TWh with a capacity addition of 980GW in 2023. China holds more than 70% share.
- China’s manufacturing capacity is expected to increase fivefold, reaching 5.84 TWh by 2025, according to Bloomberg New Energy Finance (BNEF).
- •The IEA estimates that the global manufacturing capacity of lithium-ion batteries is expected to reach 9TWh by 2030.
Domestic Market Overview
Stationary Storage
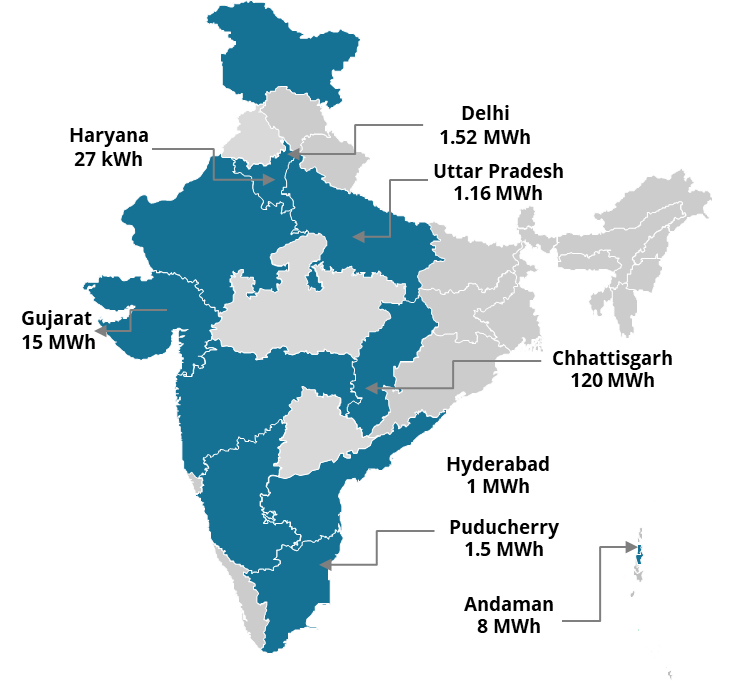
According to India Energy Storage Alliance(IESA), the current installed Battery Energy Storage System(BESS) capacity stands at 200 MWh as of 2023.
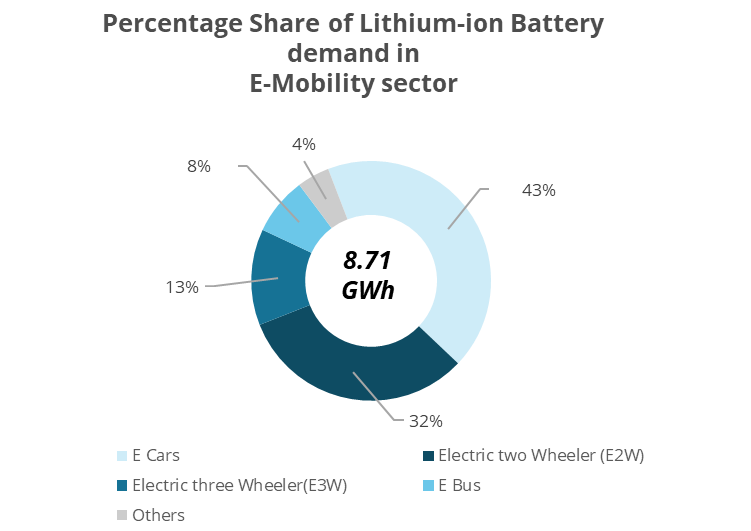
E-Mobility Sector
The Lithium-ion Battery requirement in EV sector stands at 8.71 GWh in which E-Cars and E2W holds ~43% and 32% share, respectively.
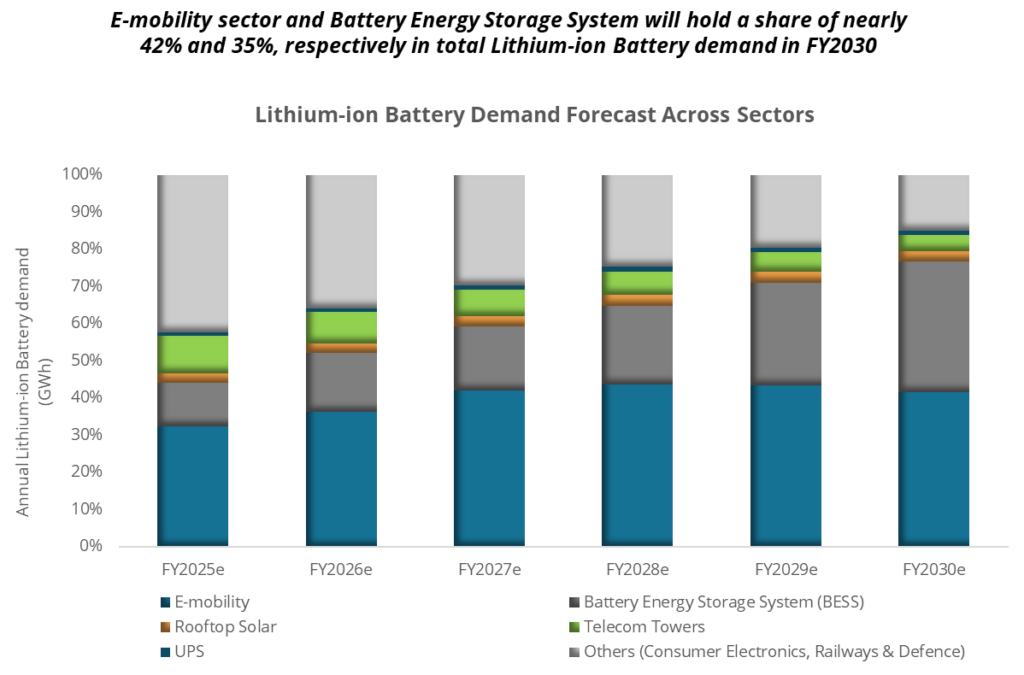
Market Overview : Lithium Battery Demand Forecast in India
Assumption:
E-mobility: The battery size of two-wheelers taken is 3kWh, three-wheelers 6kWh, four-wheelers 40kWh and buses 250kWh.
Telecom Tower: The lithium-ion battery-based telecom towers have a penetration of 60% and considering that a telecom tower typically requires 48V/100 Ah Li-ion battery bank, the energy capacity in MWh has been arrived using the factor 48V*100 Ah.
- the total lithium-ion battery demand in India will reach ~267 GWh in FY2030.
- It is expected that the annual lithium battery demand in the E-mobility sector will reach ~111 GWh in FY2030 due to various policy initiatives like PM E-bus seva yojana and PLI schemes to promote various manufacturing facilities in the domestic market, which will lead to the adoption of EVs at a large scale.
- The demand for lithium-ion batteries is anticipated to surge in the Renewable Energy segment and reach ~94GWh by FY2030, as they play a crucial role in enabling power round the clock and meeting peak power demand.
- In addition, the adoption of lithium batteries as a storage source is expected to gain momentum for telecom towers and rooftop solar installations and reach ~19 GWh in FY2030. This progress is attributed to the government’s initiative to push Renewable Energy Adoption in Telecom towers, and telecom operators are also adopting lithium-based storage for ESG compliance.
- Another key reason for adopting lithium-ion batteries could be declining battery prices, which will enhance their commercial economic feasibility on a large scale.
Market Overview – Lithium-ion Battery Demand Forecast in E-mobility Sector
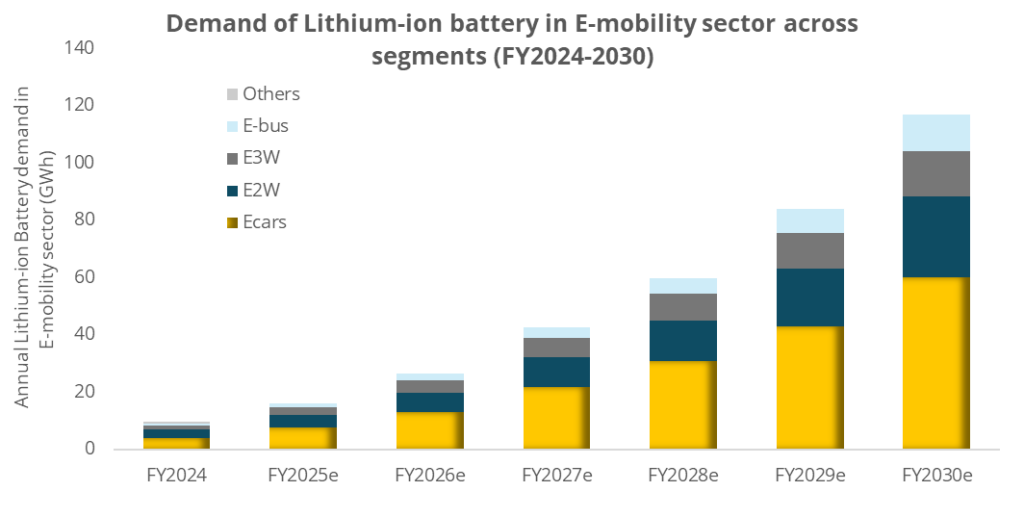
It is anticipated that the E2W & E-car will account for 75% of lithium-ion battery demand in E-mobility sector.
- In FY2024, the lithium-ion battery demand stands at 9.66 GWh in the E-mobility sector, with a maximum share of E-car constituting 54%, followed by E2W and E3W with 25% and 15% share, respectively.
- E-cars segment holds a share of 6% in EV annual sales with lithium-ion battery demand of 4GWh followed by E3W and E2W with 1.29 GWh and 3 GWh, respectively in FY2024.
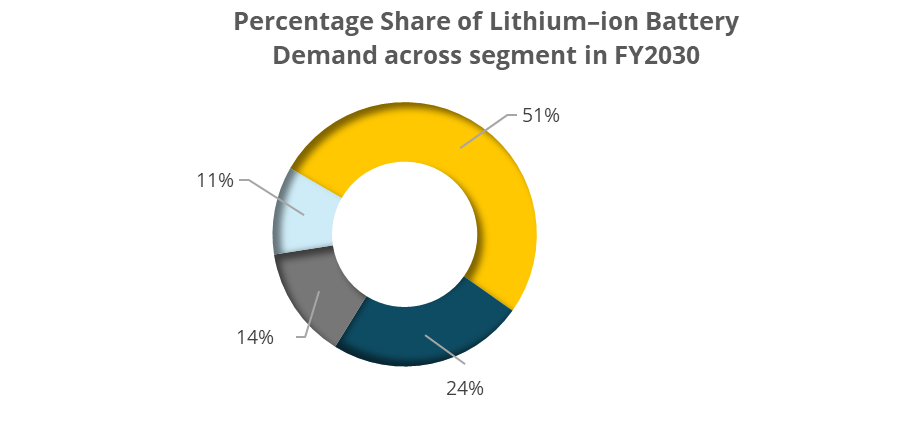
- The annual demand for lithium-ion batteries in E-mobility sector, including E2W, E3W, E-cars and E bus is projected to surge more than tenfold between FY2024 and FY2030, reaching 116.8 GWh.
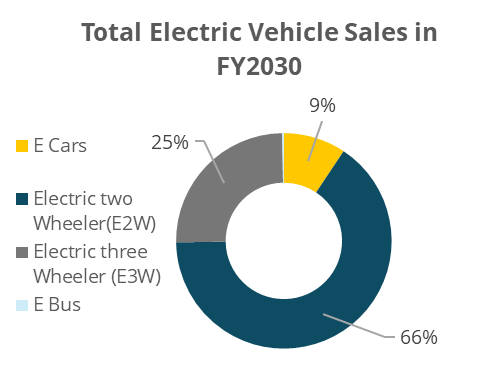
- E-car: It is expected that E-cars will account for 51% of the lithium-ion battery demand in E-mobility sector, amounting to ~60 GWh marking a 15-fold increase from current levels by FY2030. Despite the lower share of 9% of E-cars in the total annual EV sales, E-cars will hold a huge share in lithium battery demand due to their huge size i.e., 15 times of an E2W battery size.
- E3W: In FY2030, the lithium battery demand in E3W will hold a share of 14% marking an increase of twelvefold from current demand in FY2024. This growth is driven by shift from lead acid batteries to lithium-ion based batteries.
- E2W: Lithium-ion battery demand in E2W in FY2030 is anticipated to become 8 times of the current demand. The lithium-ion battery for E2W is projected to reach 28.04 GWh with a 24% share across the EV sector.
- E-Bus: It will hold 11% of the total lithium-ion battery demand in the E-mobility sector in FY2030 with the support of government schemes like PM e Bus Seva Yojana.
Market Overview: Demand Forecast for Battery Energy Storage System (BESS)
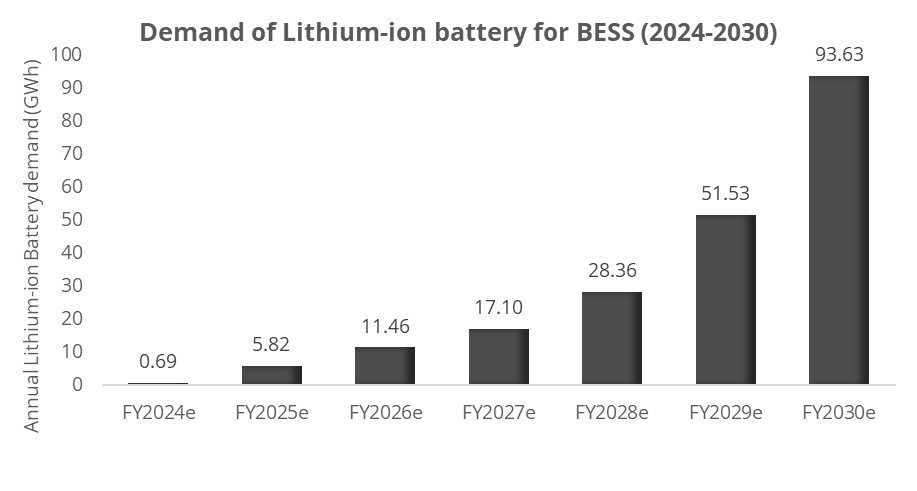
- The anticipated annual lithium-ion battery demand for BESS will reach 93.63GWh in FY2030. The main reason for such a significant rise in battery demand in stationary storage is anticipated dropping battery prices.
- As per Central Electricity Authority (CEA) estimates, the energy storage capacity required for FY2030 is likely to be 60.63 GW out of which 69% will be fulfilled through BESS.
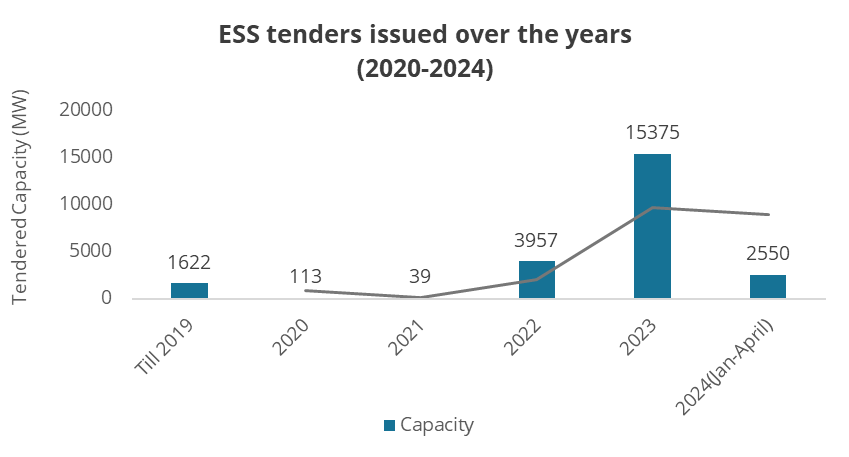
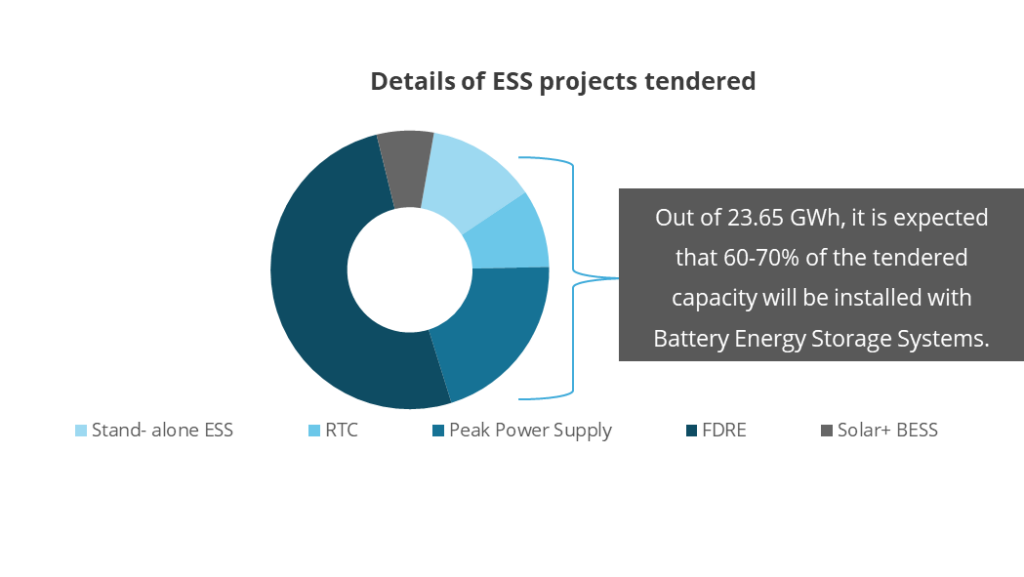
- The ESS tendering capacity has increased to 23.65 GWh till April 2024. The key reason for this increase is growing electricity peak demand and the goal to achieve RE based firm and dispatchable power (FDRE).
- FDRE holds a major chunk of share i.e. 51% of the ESS tendered capacity. The reason behind such surge is tender condition of maintaining minimum power availability i.e. 80-90%, and a penalty clause in case of failure ensuring consumers meet its RE consumption obligations
Domestic Battery Manufacturing Supply Chain
Critical Raw Materials
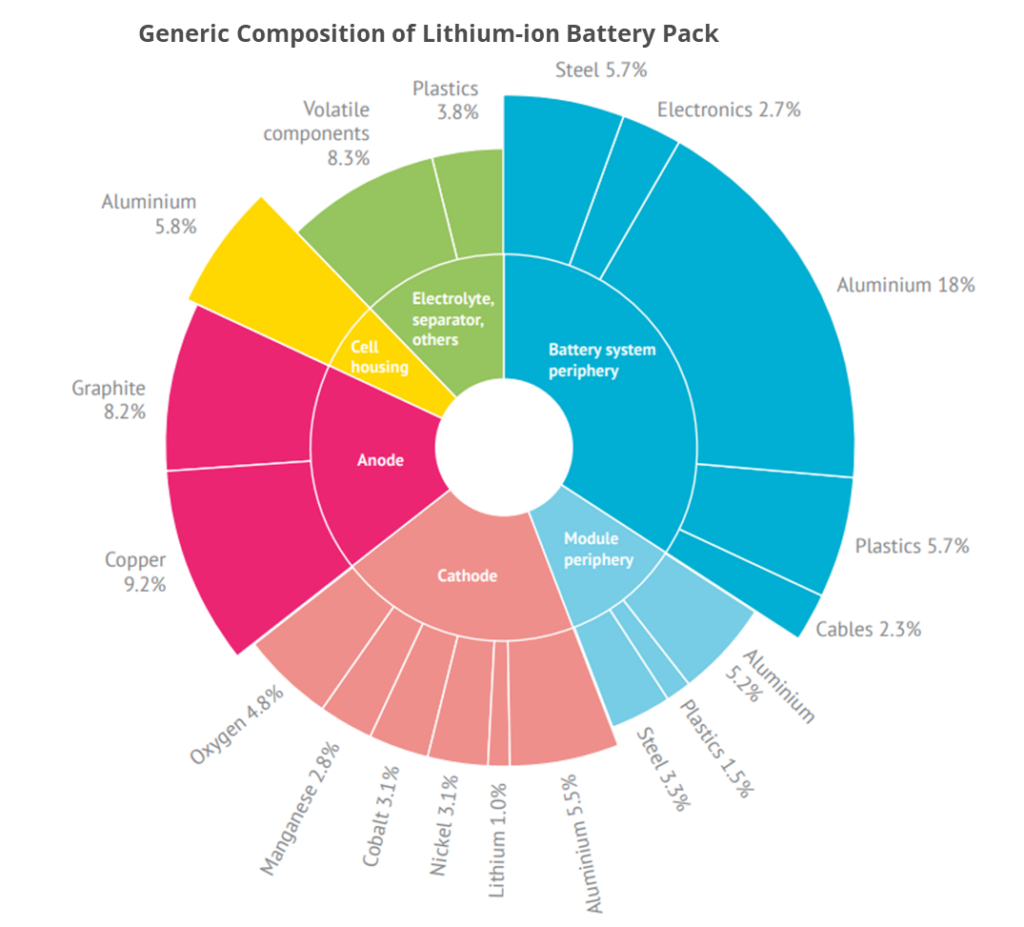
•LiB Pack consists of five primary metals: Aluminum, copper, cobalt, nickel, and lithium in which Aluminium constitutes of 34.5% followed by copper with 9.2%.
•Copper, Cobalt & Nickel are rare metals available in selected regions of the world. •A significant share of 70% of cobalt reserves are available in the Democratic Republic of Congo and Indonesia.

•Anode typically consists of copper foil covered by a fine layer of carbon, while cathode contains aluminum, cobalt, and lithium metals
Critical Raw Materials Reserves
Global status

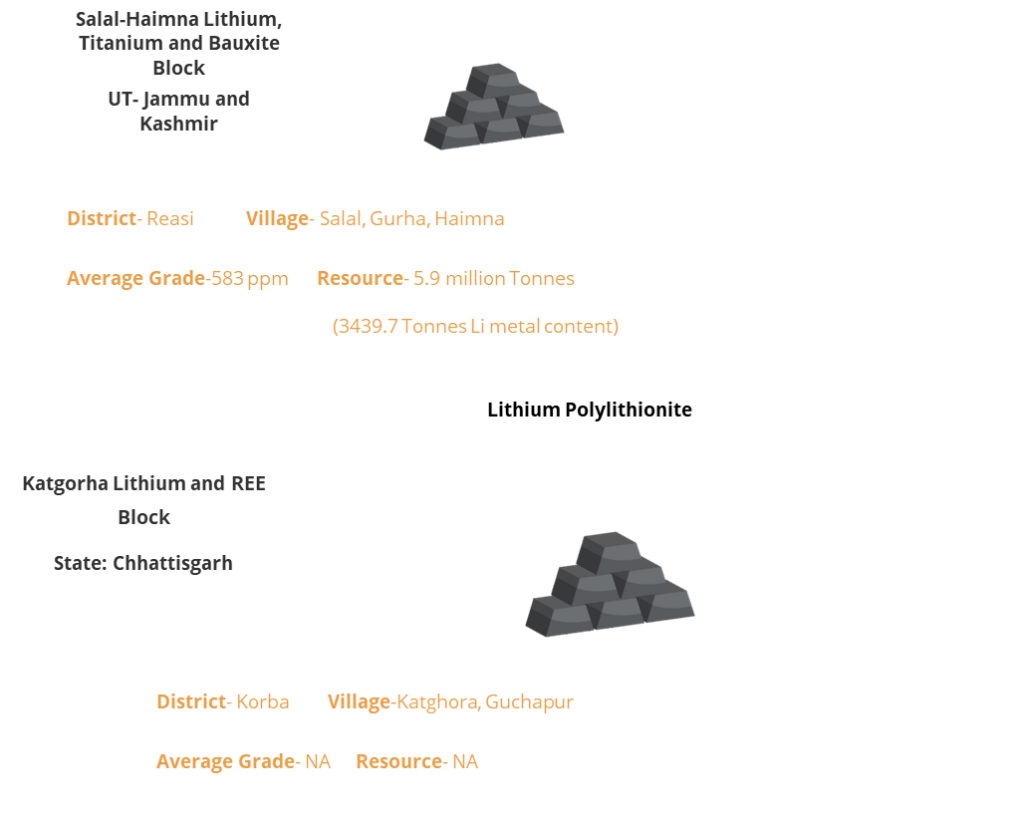
India Status

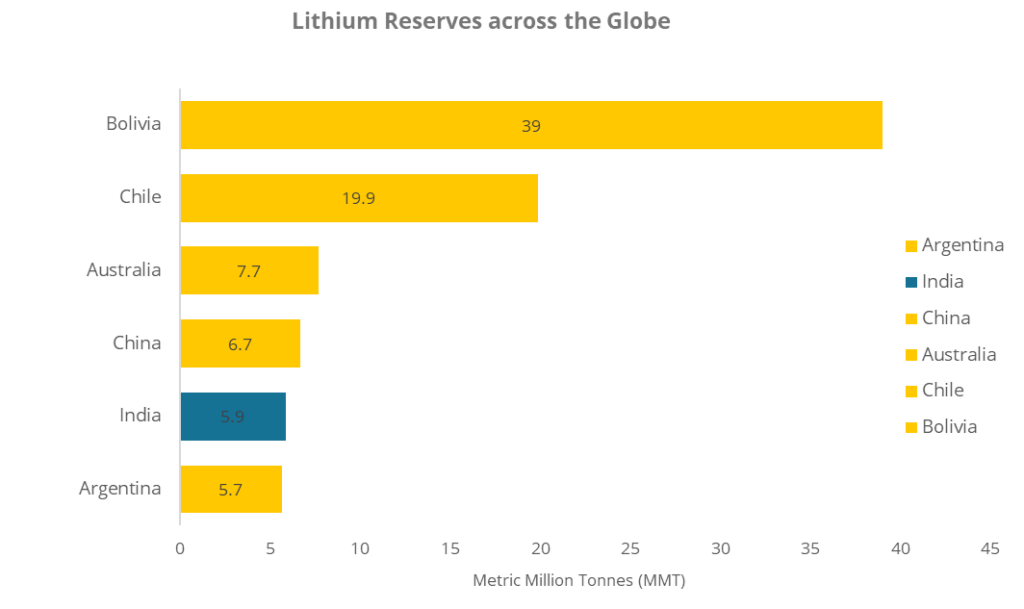
India has attained the 5th rank owing to the discovery of new lithium reserves in Jammu & Kashmir, with reserves totaling 5.92 million metric tons
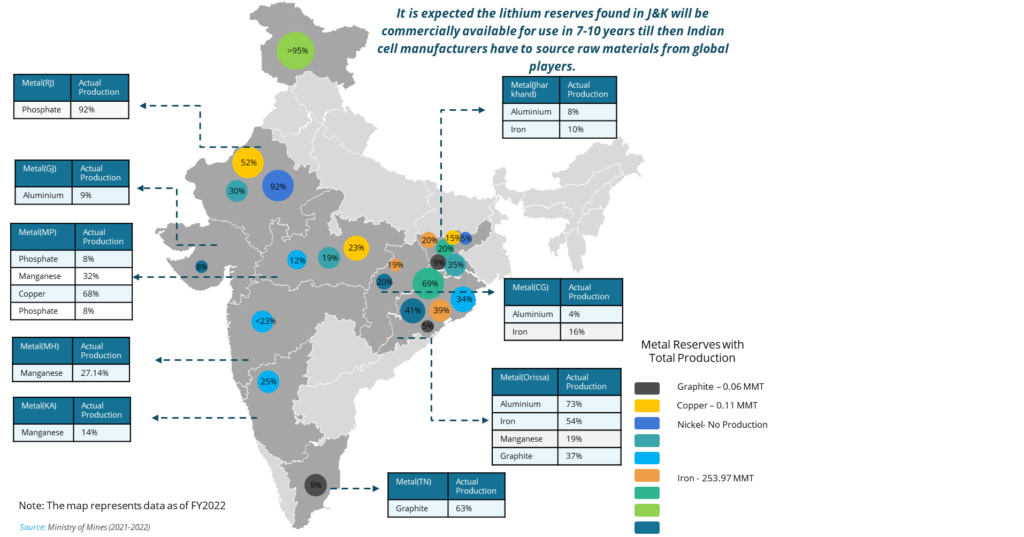
- Bauxite is an aluminum ore characterized by its high aluminum concentration. Primary bauxite ore production has increased from 21.73 MT in FY2023(Apr-Feb) to 21.88 MT during FY2024, at a 0.7% growth rate.
- In FY2024 (April to February), India achieved a record-high iron ore production of 252.21 MMT, marking a ~9.71% year-on-year increase compared to actual production of 229.81 MMT in FY2023.
- In FY2024 (Apr-Feb), manganese ore production reached 3.02 MMT, indicating a growth rate of 20.08% compared to the corresponding period with a production of 2.52 MMT in FY2023.
- In FY2024 (Apr-Feb), the production of copper concentrate reached 0.11MT marking an increase of about 10.99% compared to the same period in FY2023(Apr-Feb) with a production of 0.1MT.
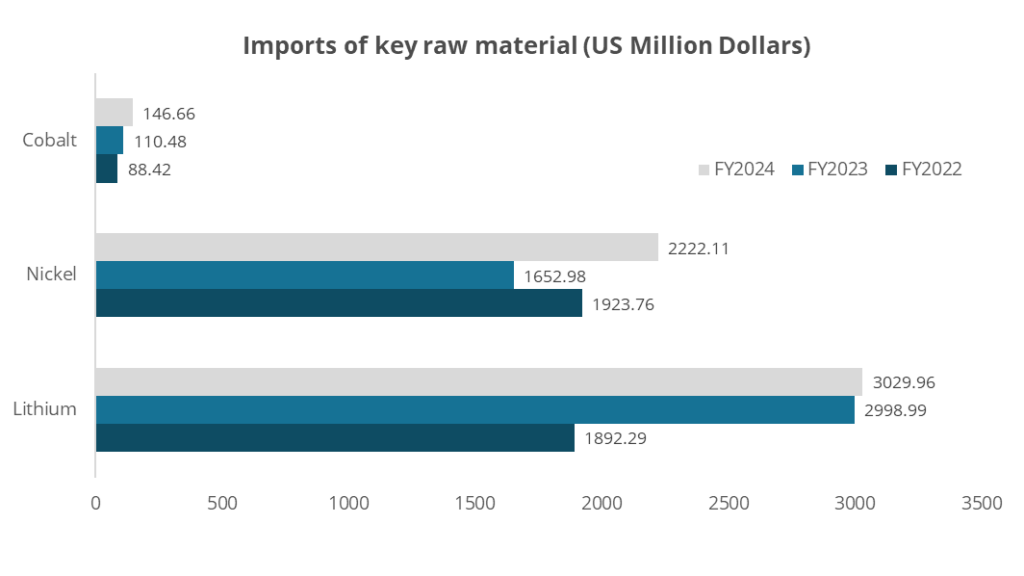
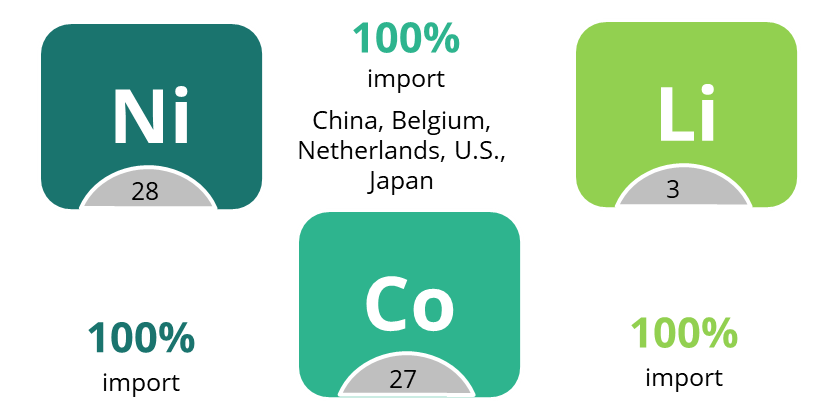
- Presently, India lacks domestic production capabilities for critical materials such as lithium, cobalt, and nickel. Consequently, it relies entirely on imports to meet its demand.
- Lithium: Currently, India relies entirely on imports to fulfill its lithium requirements, encompassing various industrial forms such as lithium oxide, lithium hydroxide and lithium carbonate. Additionally, imports include lithium cells and battery packs for smaller electronic devices and mobile phones.
- Notably, the primary import form is lithium-ion batteries, accounting for approximately 2,941.98 million USD in FY2024, predominantly for electric vehicles (EVs) and energy storage systems (ESS).
- India satisfies its lithium demand through imports sourcing from Chile, Russia, and China. •Nickel: Hindustan copper ltd. possesses a capacity of 390 million tons for the recovery of nickel sulfate; yet there has been no recorded production of nickel sulfate since 2004-05.
- Nicomet Industries Ltd., situated in Goa, currently manufactures nickel metal and its derivatives with an annual production capacity of approximately 5,400 metric tons per annum (MTPA).
- Currently, India imports nickel ores and concentrates from Indonesia, Japan, and the UAE. Nickel oxides and hydroxides are imported from Sweden, China, the Philippines, Germany, Belgium, and Australia.
- Cobalt: India maintains a modest cobalt refining capacity, estimated at 2 kilotons of cobalt sulphate annually, with Nicomet and Rubamin as the principal manufacturers in this domain.
- India imports cobalt in various forms, including cobalt waste and scrap, which accounted for about 1.5 kilo tons in 2019 and 1 kilo ton in 2020. India imports cobalt ores, oxides, and hydroxide from Belgium, China, and Finland. It imports cobalt sulphate from Finland and China.
Lithium-ion Battery Manufacturing Landscape in India
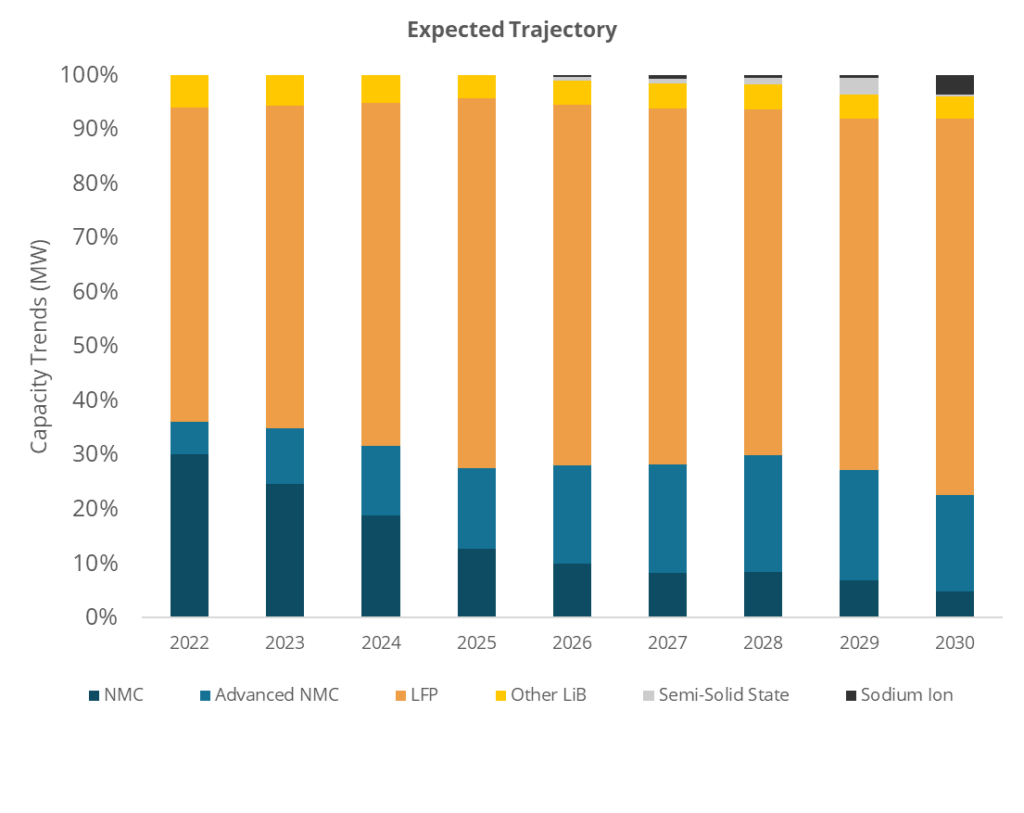
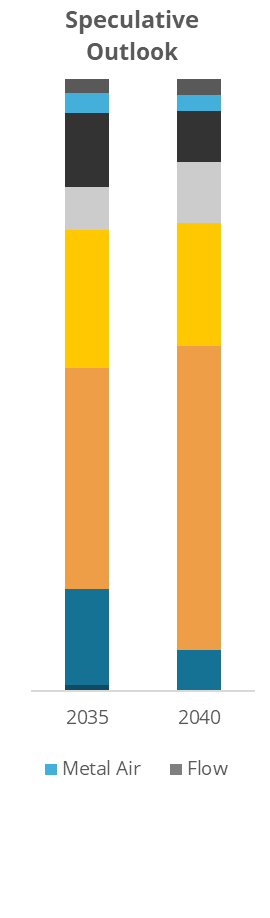
India’s Battery Chemistry Evolution (Speculative Outlook)
•Solid state/semi-solid refers to chemistries using solid-state or semi-solid electrolytes.
•‘Sodium ion’ refers to batteries using sodium ions as the charge carriers.
•‘Metal air battery’ includes both zinc and aluminium air batteries with metallic cathode and a low redox potential air positive electrode..
•‘Flow battery’ consists of two chemical components dissolved in liquid separated by a membrane includes iron flow batteries, vanadium redox flow batteries, and zinc-bromine flow batteries
- •In response to the continually expanding EV market, battery chemistry is anticipated to undergo developments to align with the evolving requirements of both consumers and manufacturers.
- •At present, the prevailing battery trajectory is characterized by the prominence of LFP and NMC chemistries. LFP chemistry is favored for electric four-wheelers (E4W), while NMC chemistry predominantly caters to electric two-wheelers (E2W).
- •Until 2030, the dominance of LFP chemistry in batteries is projected to persist due to its notable attributes of elevated energy density and advanced manufacturing capabilities on a global scale.
- •Moreover, a diverse array of alternative lithium-ion battery (LiB) chemistries such as Lithium Sulphur, Lithium Air, Zinc Air, Lithium Carbon, along with non-LiB options including Solid State, Sodium ion, Flow battery, and Semi-Solid technologies are predicted to commence gaining traction by the year 2030.
Lithium-ion Battery Manufacturing: Lithium-ion cell Manufacturing Capacity
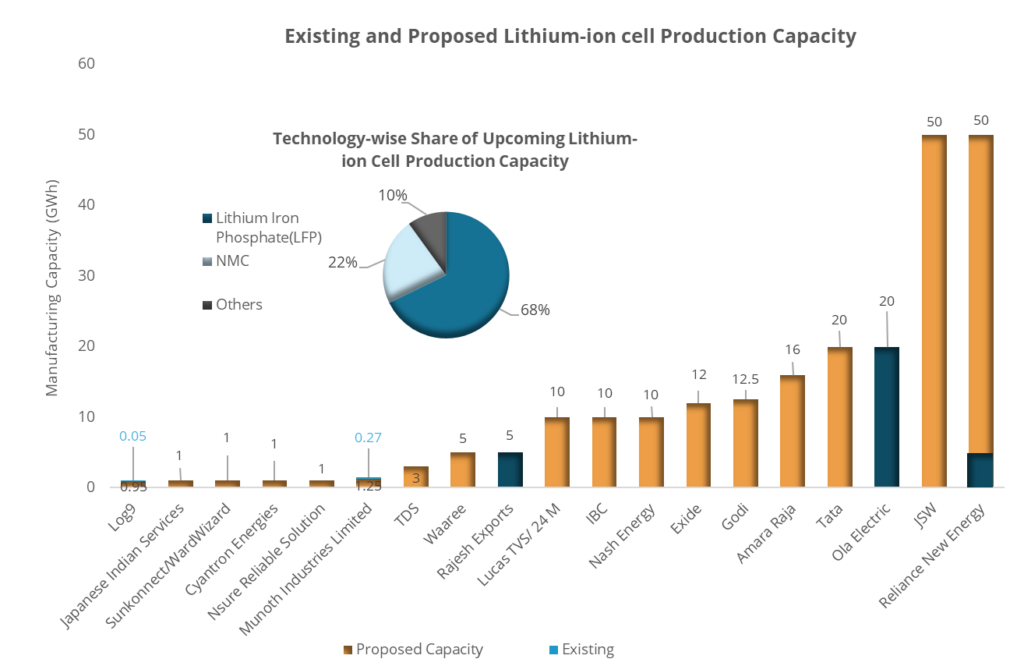
- It is anticipated that India will establish a Lithium-ion cell production capacity of ~228 GWh by FY2030.
- The principal driver behind this expansion lies in the burgeoning demand for lithium-ion batteries within the electric vehicle (EV) and stationary storage sectors. Furthermore, government initiatives, such as the Production Linked Incentive (PLI) scheme for Advanced Chemistry Cell (ACC) and the strategic action plan for critical raw materials, provide momentum to bolster indigenous manufacturing. •
- The PLI scheme for Advanced Cell Chemistry (ACC) aims to incentivize the production of 50 GWh, of which 30 GWh has been allocated in March 2022.
- A capacity of 20GWh was allocated to Ola Electric and 5GWh each to Rajesh Exports and Reliance New Energy, respectively.
- In addition to the 30GWh of ACC battery manufacturing capacity allocated by the MHI under the PLI Program, an estimated 198 GWh of battery manufacturing capacity is projected to be created by private players in the country.
- Lithium-ion cells are categorized based on cell chemistries as LFP and NMC batteries. Out of the total lithium-ion cell production capacity going to be installed, a major share of 60% will be held by LFP.
- The estimated investment needed to establish a capacity of 228 GWh is projected to range between 14.82 to 20.52 billion USD
Lithium-ion Battery Manufacturing Landscape : Import of Li-ion Cell/Battery/Components
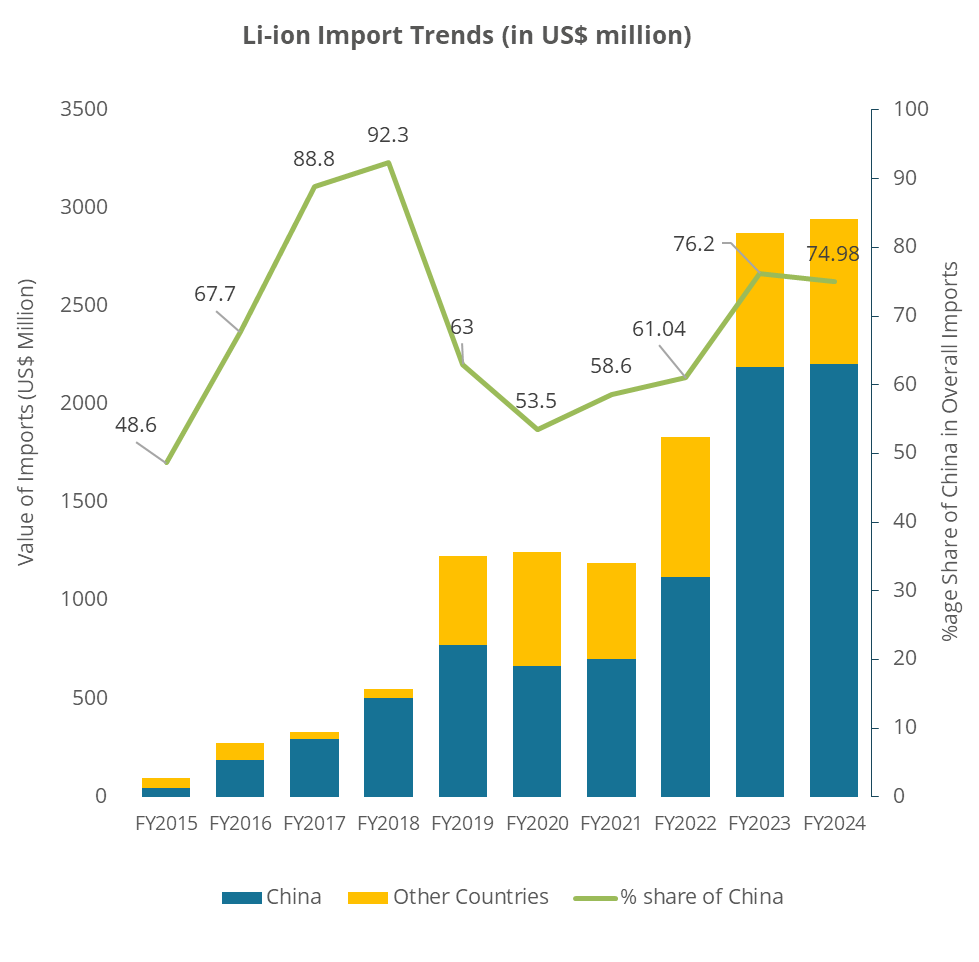
- Cells: The Indian EV industry suffers from overdependence on imports, limited local manufacturing, and finite access to raw materials and refining capacities for EV battery cells.
- The battery cells, which account for 50-60% of an EV’s cost, need to be predominantly imported from China or Taiwan and then assembled in India. The numbers indicate that India imports 70-80% of its Li-ion cell requirements from China and Hong Kong, leading to higher EV costs due to the heavy Basic Custom Duty.
- For now, India is likely to import all the raw materials required for cell manufacturing but can lower this dependency by entering into long-term contracts with raw material suppliers or acquiring some assets in mineral-rich nations for which KABIL has been formed.
Market Potential in Battery Manufacturing: LIB-based EV & Stationary Storage Market in India
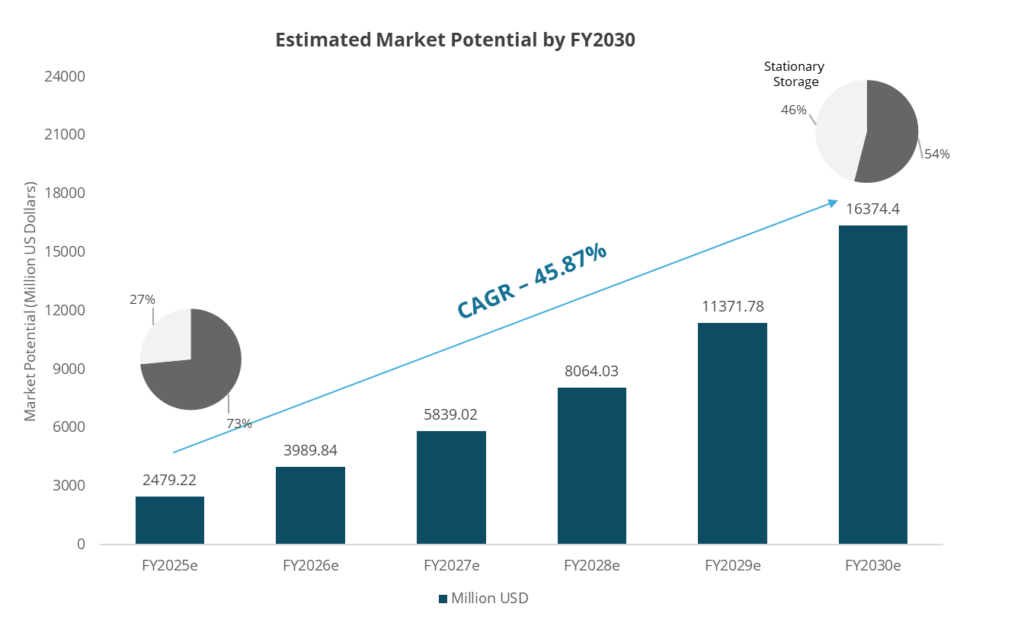
- A notable trend in the Lithium-ion Battery Market is the shift towards electric mobility and LiB-based stationary storage.
- In FY2025, the market potential for lithium-ion batteries is forecasted to reach 2,479.22 USD million, with electric vehicles (EVs) accounting for a 73% share.
- •India’s vast mobility sector is witnessing a significant shift towards electric vehicles (EVs), representing a potential market for lithium batteries valued at 1809.83 USD million in FY2025. •
- The market potential is anticipated to reach 16374.44 USD million in FY2030 because the demand for lithium-ion batteries in the electric vehicle (EV) sector and stationary storage is projected to experience substantial growth, exceeding 200 GWh by 2030.
- The market potential for Lithium-ion batteries in the EV segment is expected to undergo a compound annual growth rate (CAGR) of 37%, reaching 8841.96 USD million by FY2030. •
- Concurrently, the market potential for stationary storage is anticipated to grow, driven by a CAGR of 62% owing to increasing demand for firm power within the renewable energy sector.
Cost of Lithium-ion Battery
Battery pack (primarily constituted by cell and BMS) contributes to 40–45% of an E2W’s cost
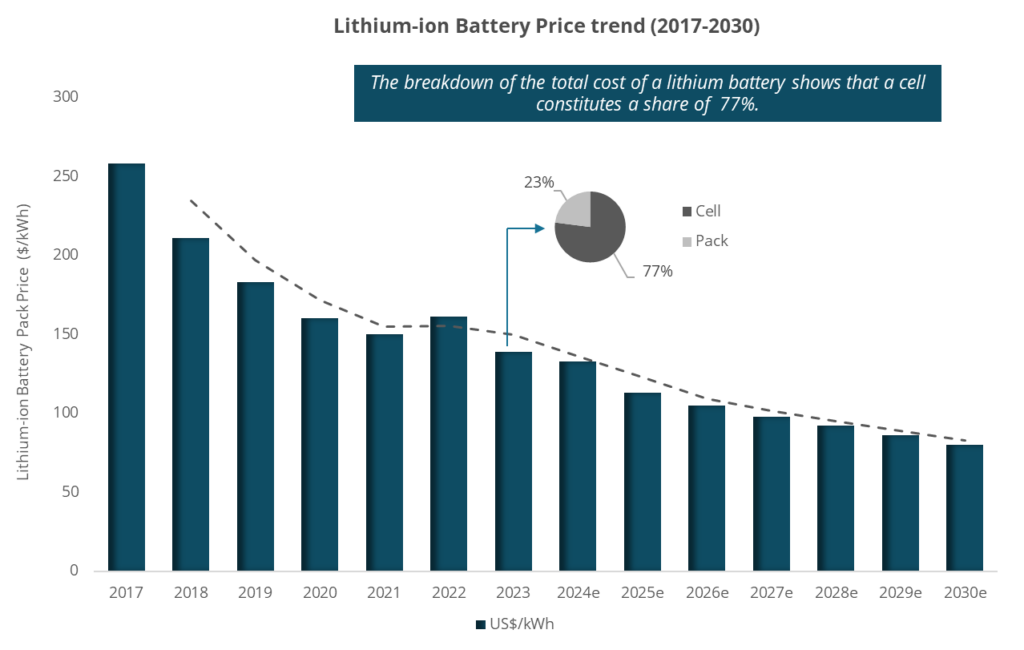
- •Li-ion battery prices fell steadily from US$258/kWh in 2017 to US$150/kWh in 2021.
- •The price of lithium-ion batteries increased by 7% in 2022 due to disruptions in the global supply chain caused by the Russia-Ukraine war.
- •Further in 2023, lithium-ion battery pack prices have dropped by 14% to a record low of US$139/kWh in 2023. •
- This decline was driven by raw material and component prices falling as production capacity increased across all parts of the battery value chain. •
- It is anticipated that further battery prices will fall by 42% till 2030 and will reach a minimum of 80 US$/kWh because of developing battery manufacturing infrastructure in other countries like the US, Europe and India.
- •With the growing demand, the manufacturing industry is increasingly adopting low-cost LFP cathode chemistry.
Cost of Lithium-ion Battery– Cost of Lithium-ion cell and Battery Pack
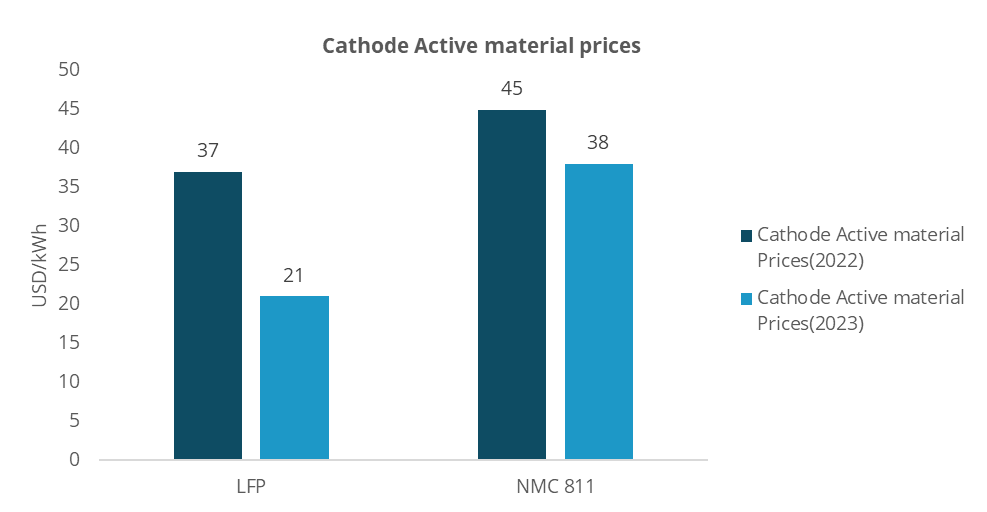
- •The cost of LFP batteries has consistently remained lower than that of higher-performance nickel-manganese-cobalt (NMC) batteries, and it is anticipated to decrease further as lithium prices decline.
- •According to S&P Global, an LFP battery is about $6/kWh cheaper than the cheapest NMC811 battery attributed to higher cost of nickel and cobalt raw material in comparison to lithium.
- •The cost of a battery pack is affected by the price of the raw materials used in the cathode, which comprises 40%-60% of the overall battery cell cost, depending on the chemistry, according to BloombergNEF.
- •Lithium carbonate constitutes 89.4% of the total raw material costs for LFP cathodes, while lithium hydroxide accounts for 62.9% of the raw material costs for NMC-811 cathodes, as per Commodity Insights data.
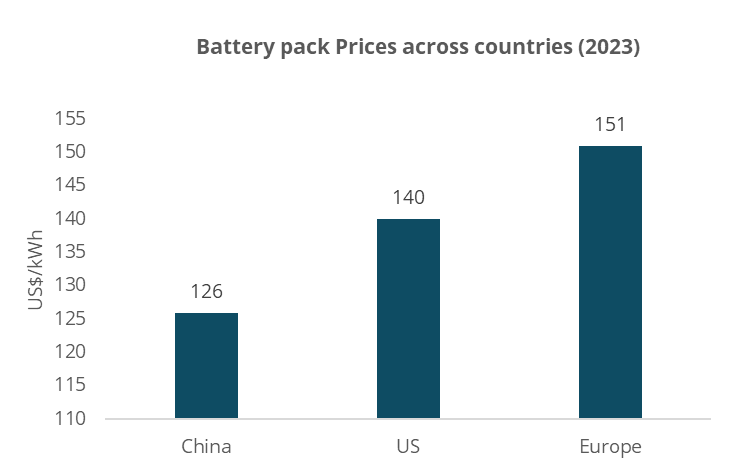
- •Currently, the costs of various Li-ion battery cells differ in different regions or countries. On a regional basis, average battery pack prices were lowest in China, at $126/kWh. The lithium-ion battery packs in the US and Europe were 11% and 20% higher, respectively. As per Bloomberg NEF estimates, India is already the lowest-cost country for manufacturing cells. The announced subsidies could reduce costs to US$ 65/kWh.
Cost of Lithium-ion Batteries – Cell Cost Breakdown and Localization Potential
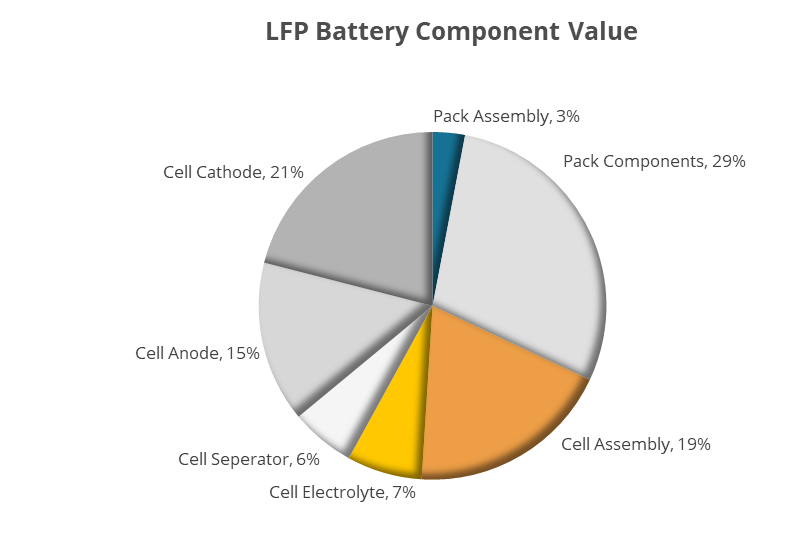
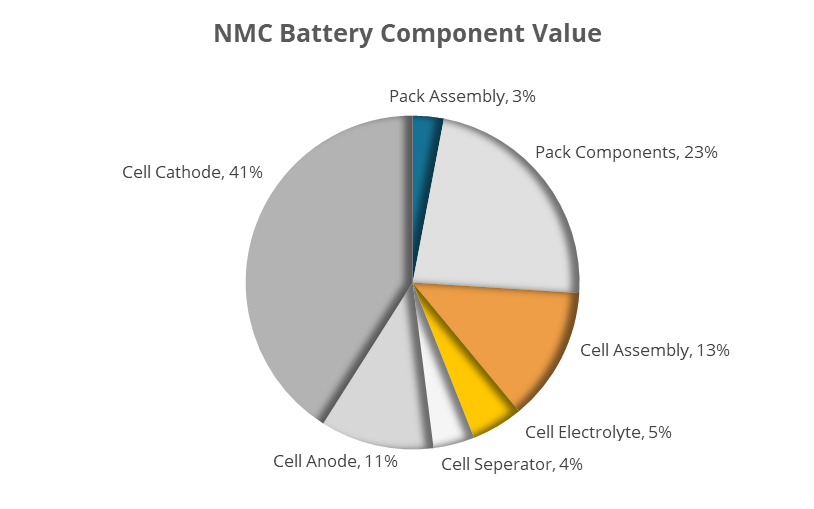
- •Taking a more comprehensive look at LFP (Lithium Iron Phosphate) and NMC (Nickel Manganese Cobalt) batteries, they can be divided into two main parts: the cell components and the pack components. The assembly of the pack and its various components constitute approximately 32% and 26% respectively of the total battery value. The individual cells can be further deconstructed into several elements, namely the Cathode, Anode, Separator, and Electrolytes. Among these, the Cathode stands out as the most expensive component in both LFP (contributing to 21% of the total battery cost) and NMC (making up 41% of the total battery cost) batteries.
- • •In India, the downstream supply chain for these battery components, including cathode, anode, separator, and electrolyte, is in its early stages. This is primarily due to challenges like a lack of available raw materials, a limited number of manufacturers, and uncertainties surrounding demand security.
- • •In India, LFP cell chemistry adoption will gain momentum due to domestic availability of iron ore and lithium ores.
Cost of Lithium-ion Batteries – Cost for setting up a Lithium-ion battery manufacturing plant in India
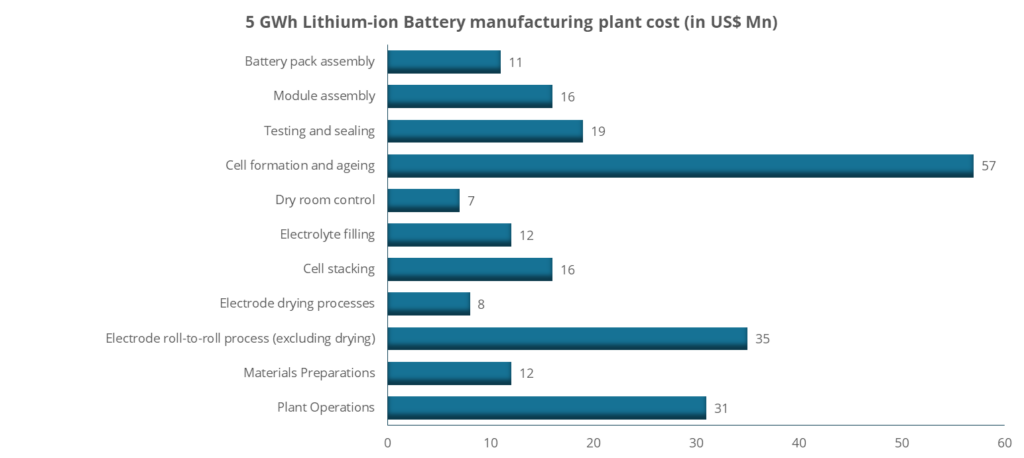
- •In this context, we are evaluating the establishment of a Li-ion battery manufacturing facility with a capacity of 5 GWh. The costs associated with setting up this plant, encompassing land procurement, factory floor area, warehousing, and utility connections, may range from US$ 325 million to US$ 450 million.
- • •The cost solely for the capital equipment within a facility with the capacity to manufacture 5 GWh of Li-ion batteries is projected at approximately US$ 234 million. To fulfill 60% of the demand by 2030 in India it is estimated that around US$ 8 billion (equivalent to INR 60,000 crore) might be needed for establishing manufacturing facilities with a capacity of 100 GWh.


0 Comments