Introduction
Rural-to-urban migration is rural India’s livelihood strategy for coping with adverse circumstances. Labor migration occurs when workers have no other options for living and employment. In many cases, they work and reside in cities for an extended period; in others, short-term or temporary migration becomes a source of income for the rural poor. (The COVID-19, Migration and Livelihood in India 2020). In addition, droughts and extreme weather events have wrecked the agricultural sector during the past two decades, further contributing to rural-to-urban migration (Climate-induced displacement and migration in India, 2021)
In the 21st century, we have witnessed a significant spike in population migration from rural to urban areas, followed by the Central Government’s 1991 introduction of economic reforms. Urbanization increased by 3.3% during 2001-2011 compared with an increase of 2.1 % during 1991-2001. (Urbanisation in India: Trend, Pattern and Policy Issues 2020)
Looking at the past, the average growth rate of the urban population clocked 2.32 % between 1951 and 1961, increasing to 3.79 % between 1971 and 1981, the highest rate since independence. After 1981, the urban growth rate slowed to 3.09 % between 1981 and 1991 and 2.75 % between 1991 and 2001. However, between 2001 and 2011, the growth rate saw an uptick. During 2001-2011, the overall increase in urban population was 91 million, the highest ever, and for the first time since 1961, the urban population increment was more significant than the rural population increment (90.5 million) (Urbanisation in India: Trend, Pattern and Policy Issues 2020)
In the future, India will have enormous challenges in keeping up with urban migration. According to the World Bank, 40 percent of India’s rural population will relocate to cities in the next 13 years to avoid the effects of climate change. Without enough infrastructure and frameworks to handle a significant number of rural populations, people would be forced to live in overcrowded urban areas with insufficient basic amenities and hazardous surroundings.
There are no indications that the rural-urban migration will slow down. More affluent regions are getting richer while poorer areas are left behind as development activities are restricted in specific areas. It will only continue to rise. This weakens the rural economy and places much strain on urban infrastructure. Policymakers must develop a plan to support the rural economy, which can limit the number of Indians migrating to urban areas and enhance the quality of life for millions of people.
This study seeks to analyse the migration patterns in India and Karnataka and identify potential factors influencing these patterns; potential remedies and suggestions will be investigated in later reports, where taluka-level analysis will be covered in greater detail.
The following research questions are addressed in this study :
1. What are the leading causes of rural-to-urban migration?
2. How much labor force migration occurs in India at the state and district levels based on gender and at the rural/urban divide?
3. What is the pattern of population migration in rural and urban Karnataka across different age groups and genders?
4. What role does the growing rural population play in migration?
5. What are the Factors and drivers of the specific migratory pattern? What are the forces that propel migration?
6. How have COVID-19 / unforeseen disasters or climate changes impacted the migration pattern?
7 What state-level
policy interventions have been implemented over the years to curb rural-urban
migration?
Methodology:
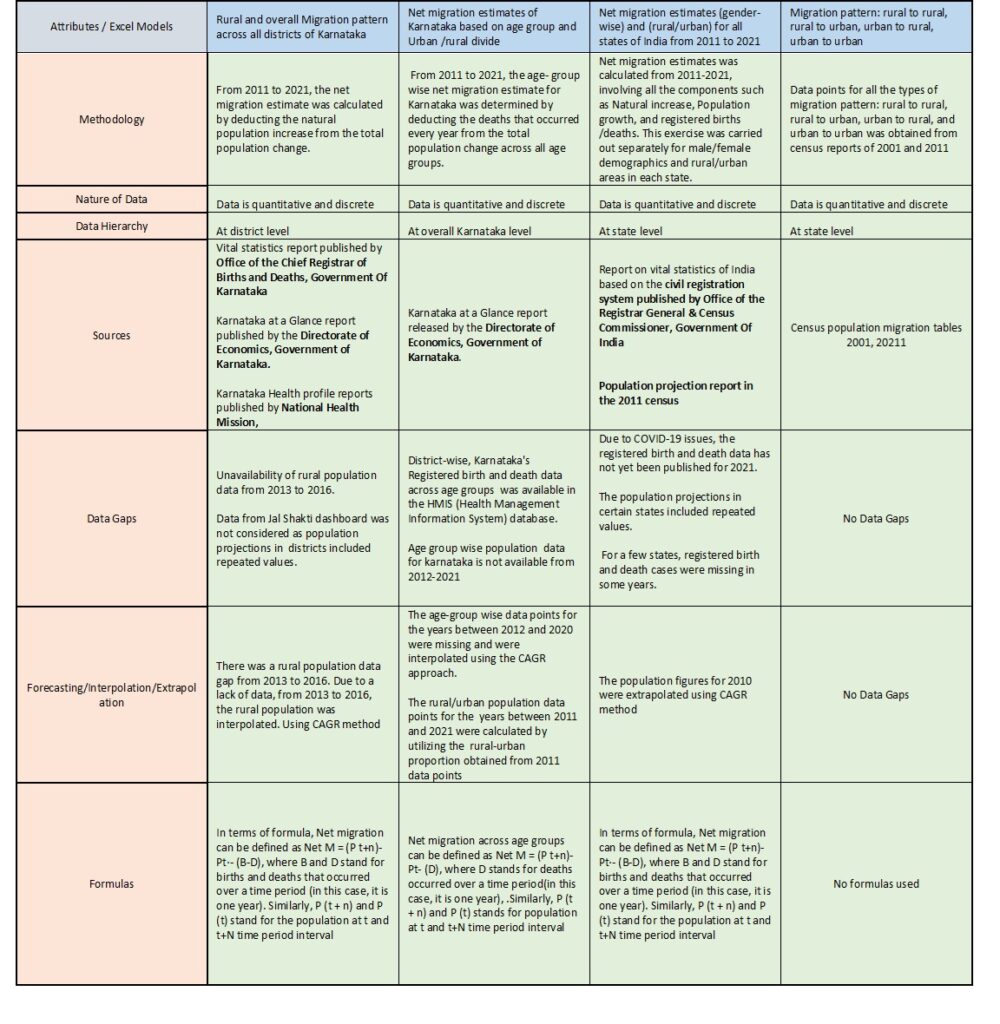
Migration Trends
| G1 | G2 | G3 |
| UDUPI | CHAMARAJANAGAR | DAKSHINA KANNADA |
| RAMANAGAR | CHITRADURGA | DHARWAD |
| MYSURU | BENGALURU | CHIKKABALLAPURA |
| BALLARI | BENGALURU RURAL | KOPPAL |
| RAICHUR |
| Marginal increase/dccrease |
Findings
The reasons for migration can be listed as follows:
Non-remunerative Agriculture: Agriculture is not profitable because of inadequate irrigation infrastructure and low output. Because of the low cropping intensity, agriculture still depends on the monsoon. As a result, the local labour force can earn little from agriculture. In addition, only a few states benefited from the Green Revolution, with the remaining states falling behind.
Lower Wages: The wages in distressed areas are significantly low, as much as less than half of what is earned in states with better prospects. As a result, they put in more hours at work and earn more money by including their wives and kids.
Lack of Employment: There are few opportunities for gainful employment at home. As a result, people migrate to states and are absorbed in construction/agriculture sector as labourers.
Small Sized Holdings: Land holdings owned by migrants are too small to allow them to use modern agricultural technologies. Typically, holdings range in size from one to two acres. Furthermore, the land mostly depends on rain and is not very productive. They cannot apply chemical fertilizers.
(Migration of agricultural labourers in Karnataka,2019)
Intra- and inter-state migration are two significant categories of migration in India. They result from the disparity in development between rural and urban areas and between states that offer better and worse employment opportunities.
Inter-state Migration pattern:
Over the last two to three decades, the growth pattern has gradually increased the income difference between rural and urban areas, agriculture and non-agriculture, and states with critical and good growth indicators.
Growth and prosperity have become concentrated in a few states and areas. While states like Bihar, Orissa, and Chhattisgarh have poor growth indicators, Karnataka, Kerala, and Gujarat have emerged as promising development regions.
States with expanding infrastructure and construction are witnessing a rise in worker migration from states with comparatively stagnant industrial development.
Bangalore is an attractive option for migration:
Bangalore is distinct in that it attracts both unskilled and highly skilled migrants.
Bangalore is a well-liked travel destination for professionals and students nationwide due to its rapidly expanding IT industry and rapidly growing electronic sector, which attracts skilled migrants.
Due to Bangalore’s extensive construction boom, impoverished rural families are moving quickly to urban areas for employment. They typically establish themselves in makeshift slum settlements.
(Evaluation Study of Migration of Labour to and from Karnataka,2017)
Intra-state migration pattern in Karnataka:
Karnataka is distinct from other states in that it has underdeveloped areas, but overall it is still “developed.”
Migration from North to South Karnataka:
In Karnataka, regional inequality has been a political problem, with the southern region of the state serving as the state’s dominant geopolitical zone. This dynamic is demonstrated by South Karnataka’s superior essential infrastructure quality, irrigation capabilities, loan availability, etc. Unsurprisingly, thousands of people migrate annually from north Karnataka to south Karnataka, exceptionally marginal farmers and landless agricultural labourers. These factors are crucial for the overall development of any geopolitical region.
Migration from Interior-regions to Coastal Karnataka:
Most migrant workers in and around the coastal districts are from other regions of Karnataka. These coastal areas offer greater chances for earning higher wages in the construction sector
(Evaluation Study of Migration of Labour to and from Karnataka, 2017)
(Identification of the Determinants of Rural Workforce Migration: A Study of Construction Segments in Udupi District, Karnataka, 2020)
Impact of Climate change on Migration:
Karnataka’s agricultural economy comprises areas with assured irrigation coexisting with large areas vulnerable to drought.
According to data from the Karnataka State Natural Disaster Monitoring Cell (KSNDMC), only the coastal region was unaffected by drought between 2001 and 2015; the other regions experienced drought because they did not receive enough rainfall.
Drought led to an increase in migration outflow from Chikkamagaluru and Northern Karnataka
For example for many years, Chikkamagaluru has experienced water shortages, which explains their higher migration outflow.
In north Karnataka, which has historically been an undeveloped area, water scarcity has worsened the joblessness crisis. Due to crop losses brought on by the drought, farmers are now in debt and vulnerable to moneylenders.
Predominant Age group of labor work-force:
Age is a crucial factor when engaging in any economic activity. The 15–59 age group is called the “working age population.” One of the key elements in analysing labour force participation in migration activity is age.
Most migrant workers are labourers in the construction industry, either unskilled, semi-skilled, or casual.it is a labour-intensive industry that creates the second-largest number of jobs, so if we were to examine the working age distribution of those employed in the industry, we could determine which age group makes up most of the migrant labour force.
A study conducted in the Udupi District’s construction segments revealed that, of the 150 migrants, 60% were in 20-30 age group category. This suggests that most migrants are young people in the 25-34 age group category
(Identification of the Determinants of Rural Workforce Migration: A Study of Construction Segments in Udupi District, Karnataka, 2020)
Reverse migration trends in India and Karnataka due to covid 19
The primary states of migration for migrant workers are Uttar Pradesh (UP), Bihar, Madhya Pradesh (MP), and Rajasthan; the major states of destination for these migrant workers are Delhi, Kerala, Maharashtra, Gujarat, and Tamil Nadu (Challenges of reverse migration in India: a comparative study of internal and international migrant workers in the post-COVID economy, November 2021).
However, the covid situation reversed this migration trend. Abrupt declaration of a lockdown halted all economic activity, and compelled the workers to return back to their native places. Due to lockdown, the informal sector was hit badly, which employs 93% of all workers in the nation.
The labour workforce reverse-migrated from traditional destination regions such as Delhi, Kerala, Maharashtra, Gujarat, and Tamil Nadu to their backword native places.
This trend was also seen in Karnataka, as people migrated back from Bangalore to their homes in North Karnataka
(Challenges of reverse migration in India: a comparative study of internal and international migrant workers in the post-COVID economy, November 2021).
Intervention by the Government
- During the 2019 and 2020 monsoon seasons, using cloud seeding operations, Karnataka increased rainfall. The State government attempted to manipulate the impending monsoon and seize as much water as possible by using cloud seeding.
- In order to create more jobs, the government raised the number of man-days in 2018 through the MNREGA Scheme.
- By the Reserve Bank of India Direction 2017, the government directed in November 2018 that scheduled commercial banks and small financial banks provide relief to the drought-affected regions.
Conclusion
Due to the country’s rapid urbanization, India’s rural economy, which supports almost 65% of its total population, has declined its contribution to national output over time. This reflects the decline in local production and revenue generation in the rural sector and the increasing migration of rural residents to urban areas.
This is a distressing sign because it shows the inability of rural areas to provide livelihood opportunities to people and an ever-increasing challenge for urban areas to accommodate overcrowded populations who are living in filthy conditions and without access to basic amenities. These vulnerabilities were exposed when rural areas where unable to provide employment to migrants returning back to rural areas due to covid-19. In late May 2020, during the third phase of the lockdown, Action Aid conducted a nationwide survey revealing that more than 74% of the respondents had lost their jobs, and 50% had not received any pay since the lockdown was implemented. (THE PANDEMIC AND MIGRATION CRISIS IN INDIA, 2021)
This study tries to analyze the trends for rural-to-urban migration across states/districts in India and Karnataka respectively. Possible reasons have been explored in the report that explains the migratory trend such as climate change, lack of infrastructure etc.
To understand the root causes, detailed study is required at taluka level on parameters such as financial institutions, agriculture and livestock, economic development, and local businesses and infrastructure development, including transportation, healthcare, and education.


0 Comments