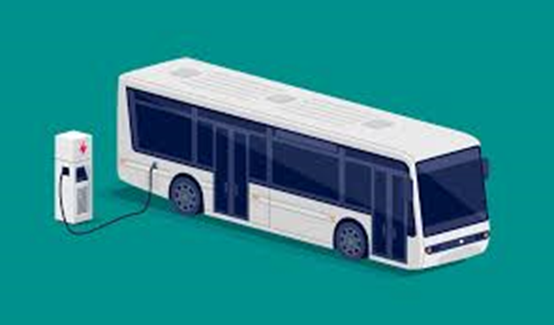
Importance of E-bus
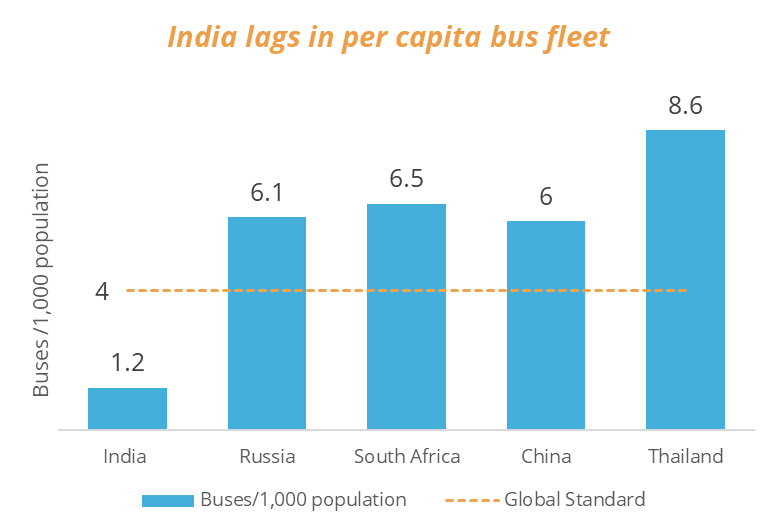
Bus (ICE+EV) Landscape in India – Lags global standards
Currently, India has only 1.2 buses per 1,000 people, which is lower than the standard for developing nations.
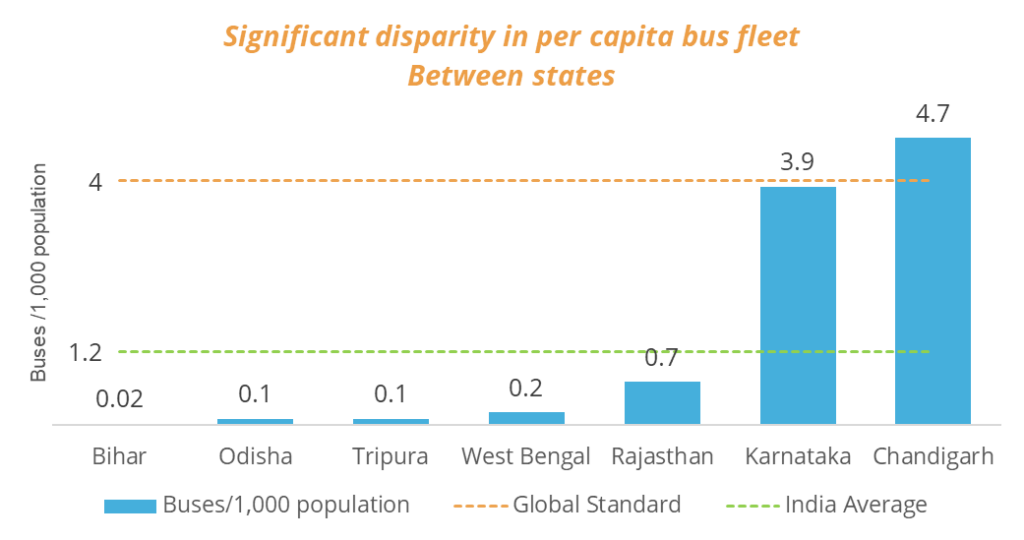
Additionally, there is a significant disparity between states, with Karnataka having 3.9 buses per 1,000 people, while Bihar has just 0.02 buses per 1,000 people
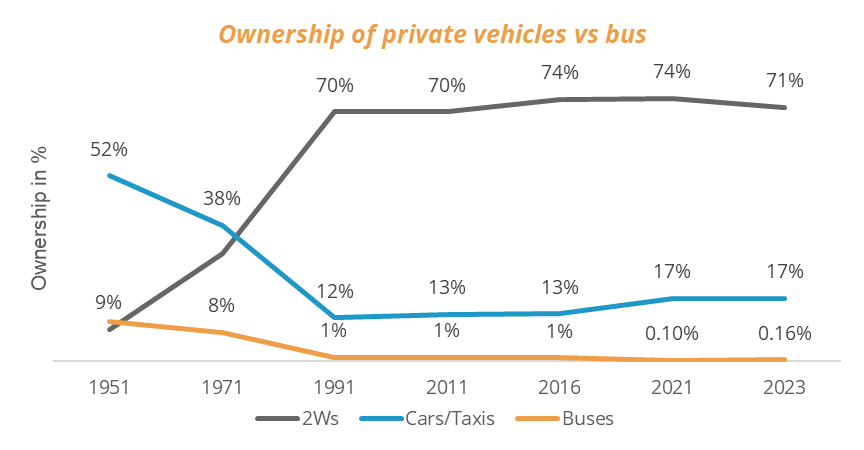
- The expansion of bus systems has not kept pace with the growth in transport demand. While road passenger traffic is estimated to have increased by approximately 15.4%, the bus fleet is estimated to have grown at a slower rate of 7%. Presently, privately owned vehicles constitute 87% of all registered vehicles, whereas buses account for a mere 0.74% of the total.
- India’s bus-based public transport lags other countries, in terms of no. of fleets, both developed and developing. For instance, nations such as Brazil, Thailand, China, Australia, the UK, and the USA boast between two to eight buses per 1000 people. Cities like London, Seoul, Sao Paulo, and Bogota have emphasized bus transport investments and observed a rise in bus ridership.
- These nations have attained high levels of bus transport provision through deliberate policies, regulatory and institutional reforms, and financial backing from both national and city governments. These efforts prioritize bus systems and aim to increase ridership.
Bus (ICE+EV) Landscape in India – Market Segments
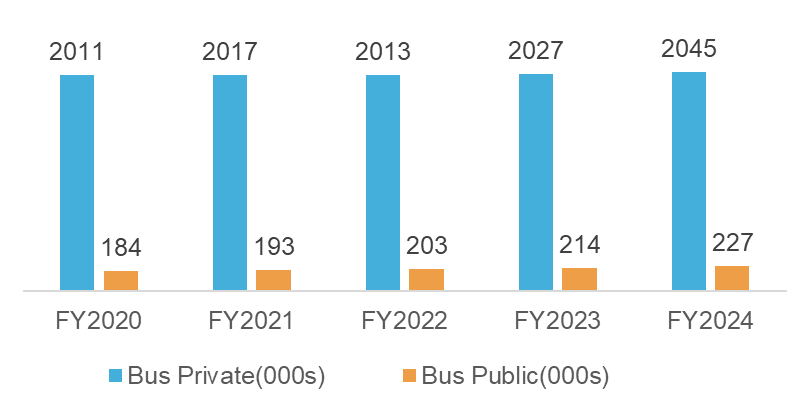
Currently, only Public Transport Authorities (PTAs) and State Transport Undertakings (STUs) are engaged in e-Bus deployment. Private entities, which account for approximately 90% of the total bus market, also need to take a leading role in this initiative.
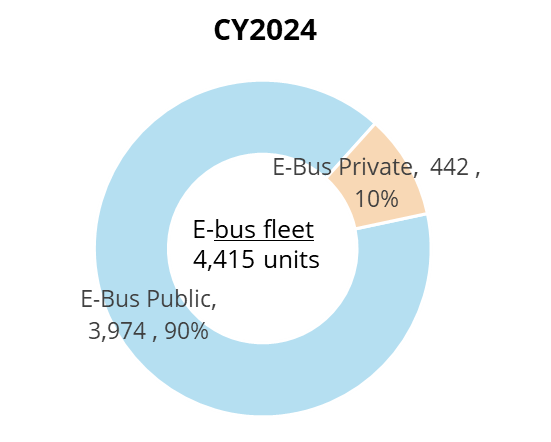
No. of Buses – Public vs Priv
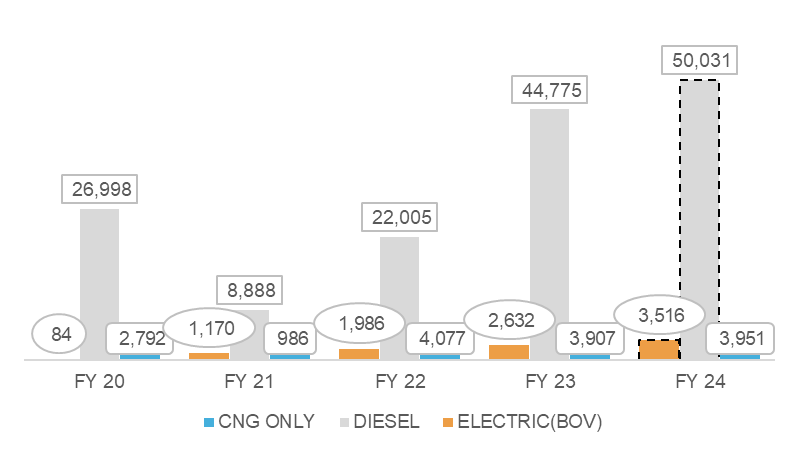
No . of Buses – Annual bus registrations by fuel type
Importance of E-Bus – Opportunity to reduce daily traffic congestion and emissions
Buses fulfill 85% of the passenger demand in road transportation, making them the backbone of the country’s mobility infrastructure. However, the lack of available buses has driven people to acquire private vehicles leading to traffic congestion and air pollution. E-buses present a unique opportunity to decarbonize a substantial portion of daily travel.
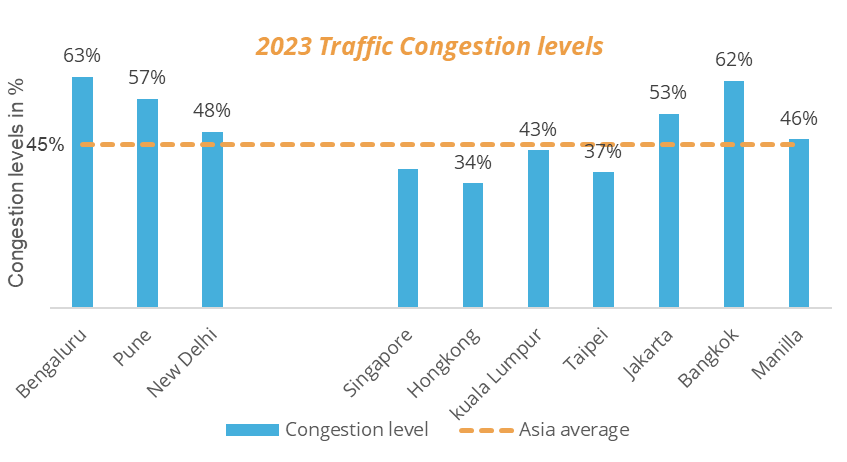
Major Indian cities are regularly listed among the world’s most congested significantly contributing to air pollution
The lack of available buses has pushed people in both urban and rural areas to own private vehicles such as 2Ws leading to traffic congestion
- The consequences of unplanned traffic extend far beyond wasted time; they also include significant fuel and monetary losses. According to a report from the Boston Consulting Group, congestion cost India a staggering $22 billion in 2019. Without intervention, this cost is projected to climb to an even higher $37 billion by 2030.
- The impact of traffic congestion on individuals is equally severe. On average, Indian drivers spend an astonishing 135 hours per year stuck in traffic, resulting in frustration and substantial fuel wastage, which collectively amounts to $22 billion. To put this in perspective, it equates to approximately 50 days of lost work per driver annually. •
- Strategies like encouraging a modal shift towards mass public transport systems, enhancing fuel efficiency, transitioning to electrification, implementing travel demand management measures, and promoting cleaner vehicles can help alleviate the impact of traffic congestion. As per report by WRI India , a 30% transition in passenger kilometers from personal vehicles and taxis to public transport could result in a 31% reduction in fuel consumption and a 24% decrease in carbon emissions compared to the current business-as-usual scenario.
Importance of E-Bus – Decarbonizing Indian Bus Market
Electrifying the bus segment in India brings two significant advantages: the decarbonization of urban transportation and the decrease in hazardous exposure in polluted cities. India ranks as the world’s second-largest bus market, following China, selling around 90,000-100,000 units annually. Nonetheless, over 95% of these units run on diesel fuel.
E-BUS MARKET OVERVIEW IN INDIA
Electric Bus Market – Current Status & Market Share
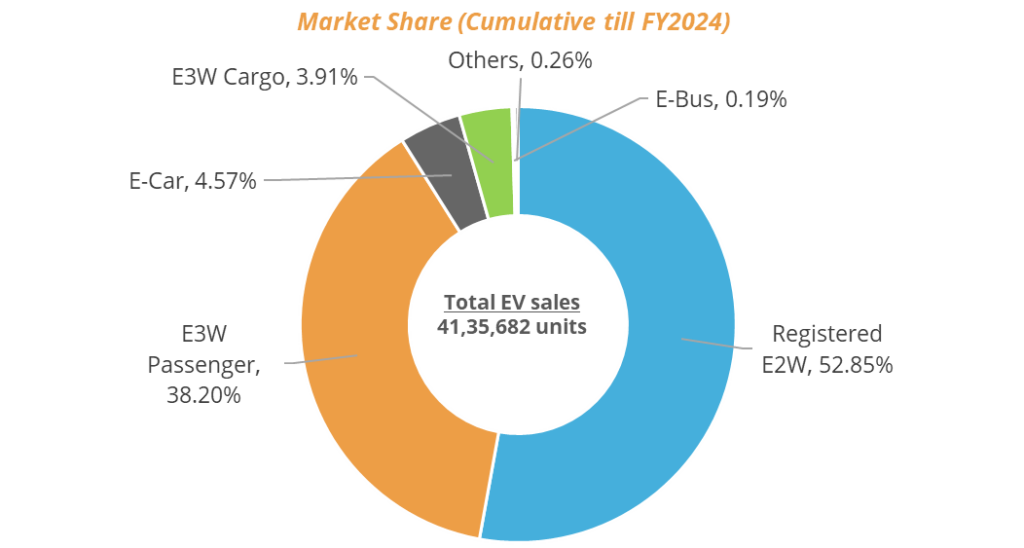
In India, the electric bus market is still emerging, making up just 4.9% of total bus registrations and only 0.19% of overall EV sales. This is notably less than the popularity of electric two-wheelers (E2Ws) and electric three-wheelers (E3Ws). Nonetheless, despite being in its early stages, the electric bus market is expected to experience rapid growth in the future
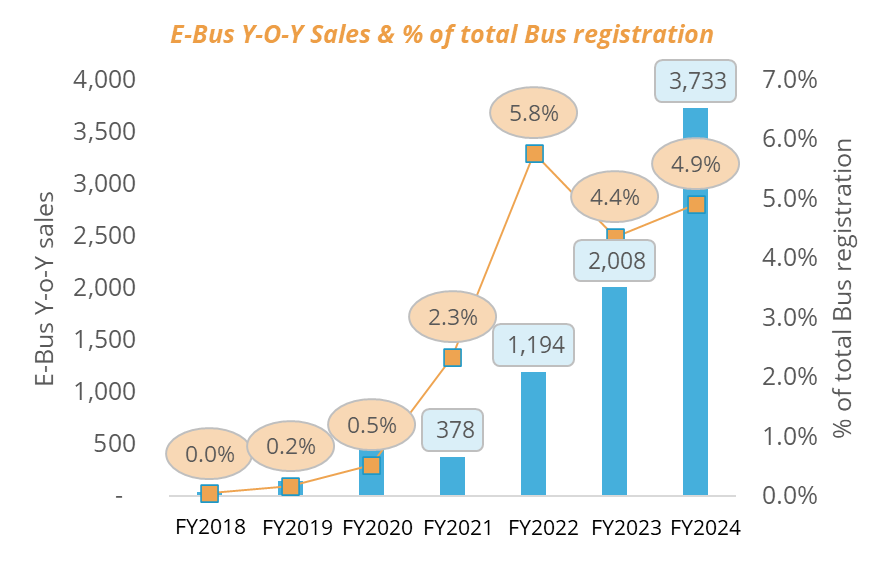
- In India, the electric bus (e-bus) market is steadily gaining momentum as the country aims to address pollution and improve urban transportation. The e-bus market in India is still in its early stages but experiencing steady growth. While electric two-wheelers and three-wheelers have seen more significant adoption due to their affordability and suitability for last-mile connectivity, e-buses are gradually gaining traction, especially in urban areas.
- By the end of the fiscal year (FY) 2024, the total sales of e-buses in India had reached 3,733 units. Despite this, the e-bus industry only secured a modest 0.19% of the overall electric vehicle (EV) market share during FY2024. However, it’s noteworthy that the number of e-buses sold in FY2024 had increased by nearly 85% compared to FY2023. This notable surge in e-bus adoption can be attributed to favorable contracting terms offered under the Gross Cost Contracting (GCC) model. These terms include assured rentals, fee revisions linked to inflation, and the absence of traffic risk, which have incentivized the adoption of e-buses among operators.
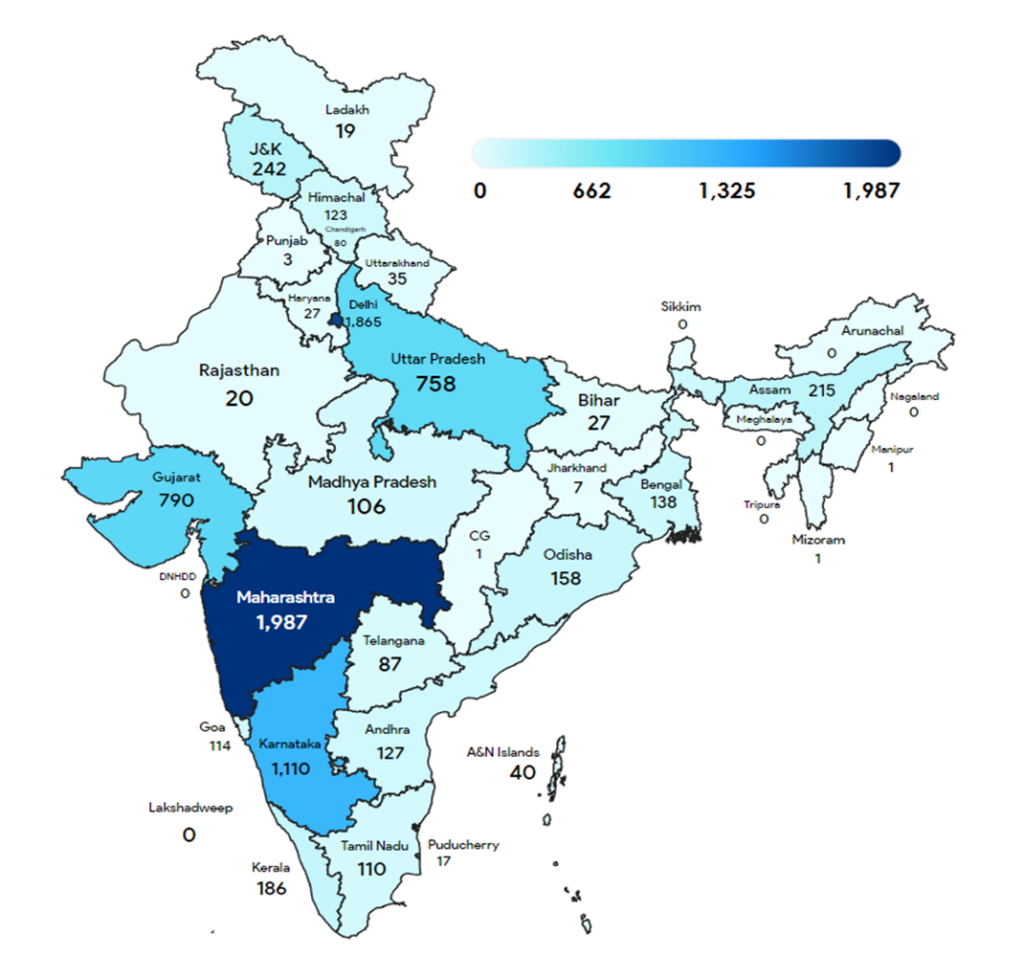
Electric Bus Market – Total E-buses Registered
E-bus sales split across different verticals
Private sector hesitation to adopt e-buses is driven by the high initial costs, while government efforts in India have primarily focused on intra-city urban routes, where Type 1 buses dominate due to strong demand from government tenders.
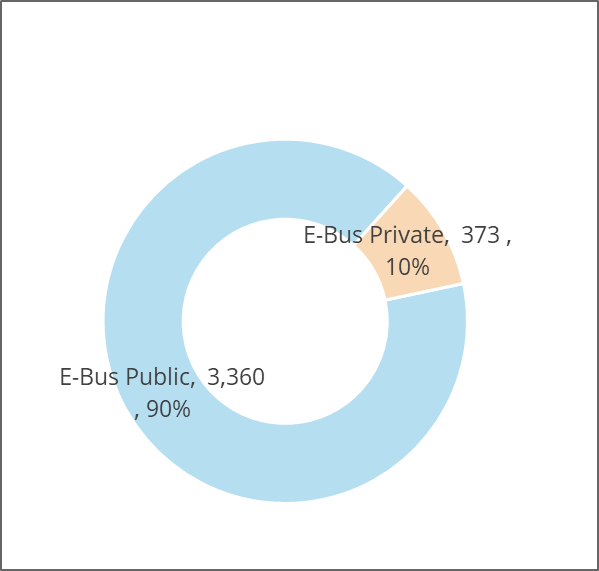
E-Bus Sales – Public vs Private assessment
The main reason for the private sector’s reluctance to transition is the significant initial expense of acquiring an e-bus.Currently, an electric bus is four times more expensive than a diesel bus. However, for a profitable investment, its cost would need to be between 1.5 to 2 times that of a diesel bus.
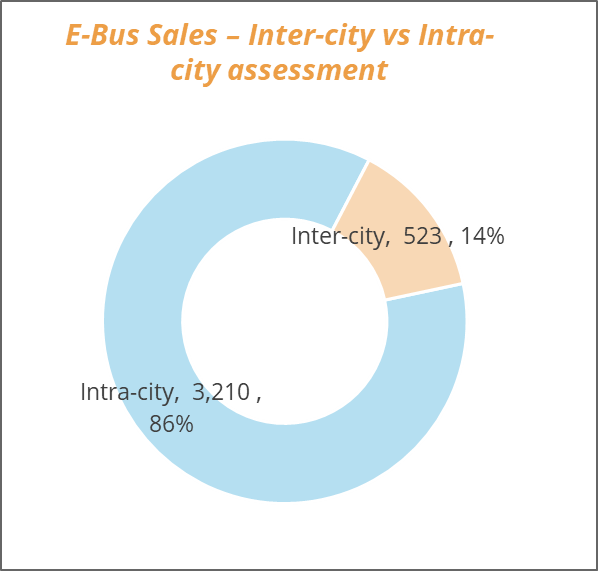
E-Bus Sales – Inter-city vs Intra-city assessment
•Efforts to adopt e-buses in India by the government have primarily concentrated on intra-city urban bus services. •
−This focus is due to the lower daily-kilometre (km) usage compared to intercity buses, making it easier to address range limitations issues
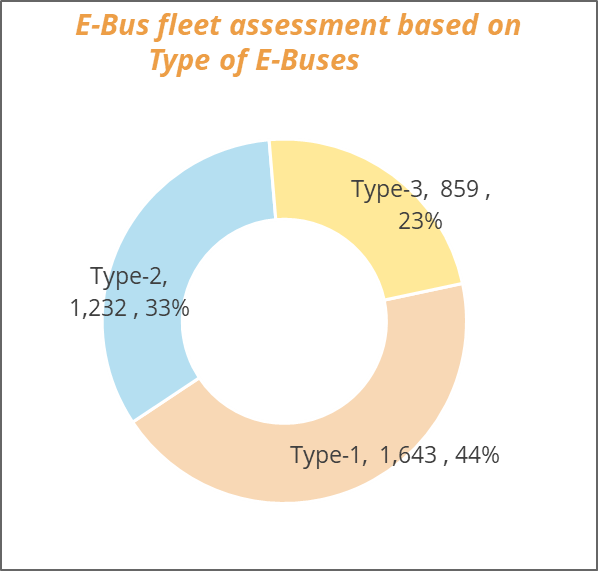
E-Bus fleet assessment based on Type of E-Buses
•The share of Type 1 buses is significant because they primarily serve the intra-city segment, which is seeing strong demand from government tenders. •
− These tenders are also extending into tier 2 cities, where narrower lanes make the 9m Type 1 intra-city buses the ideal choice.
Bus Market (ICE + EV) sizing estimates- India Market
India’s growing population, rising disposable income and tourism are driving demand for affordable and luxury buses, with modern amenities like Wi-Fi, personal screens, and eco-friendly, fuel-efficient options increasingly preferred by customers.
- Drivers and trends
- Indian customers are increasingly opting for buses that offer comfort, modern interiors, amenities like Wi-Fi and personal screens, along with a growing preference for eco-friendly and fuel-efficient options.
- In India, a key market trend is shifting towards electric buses, encouraged by government incentives to reduce pollution and fossil fuel use.
- Additionally, the demand for luxury buses is rising, driven by tourism and higher disposable incomes, offering premium features for long-distance travel. •
- India’s large population drives high demand for public transportation, with buses being a key affordable option. Government investment in expanding services has created a promising market for bus manufacturers and suppliers. •
Bus Market(ICE + EV) sizing estimates- Growth Rationale
The market assessment for buses up to 2035 has been conducted on the assumption that the growth trajectory of buses in India is influenced by overall passenger travel demand trend
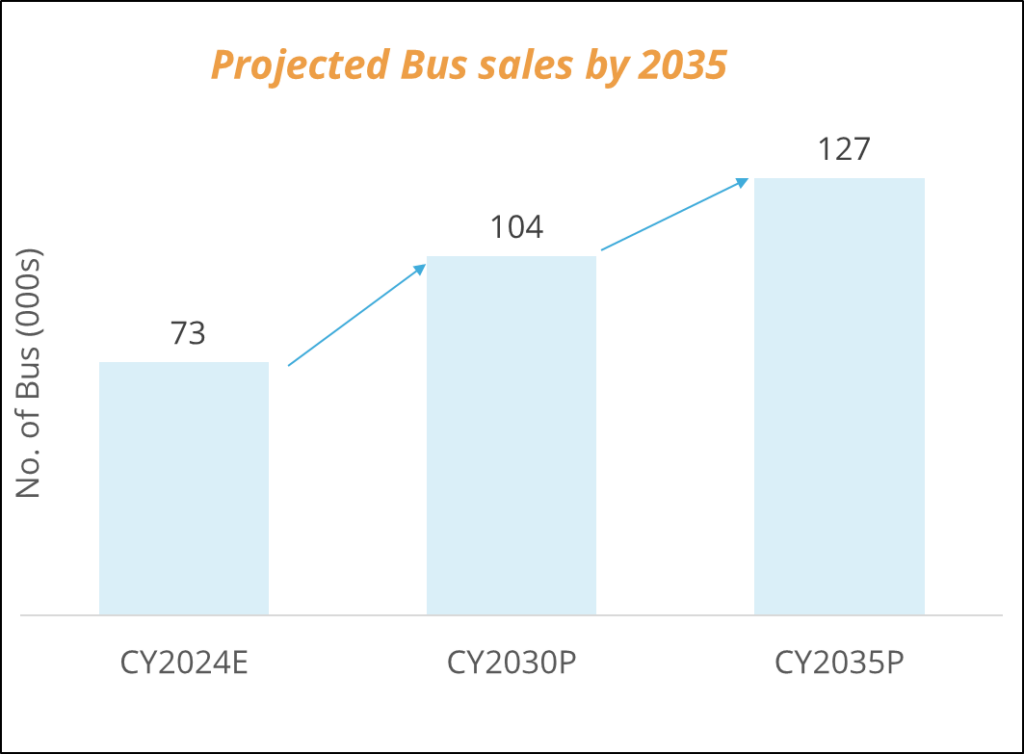
Projected Growth of Bus Fleet in India by 2030 based on Travel Demand Trends and Economic Activity
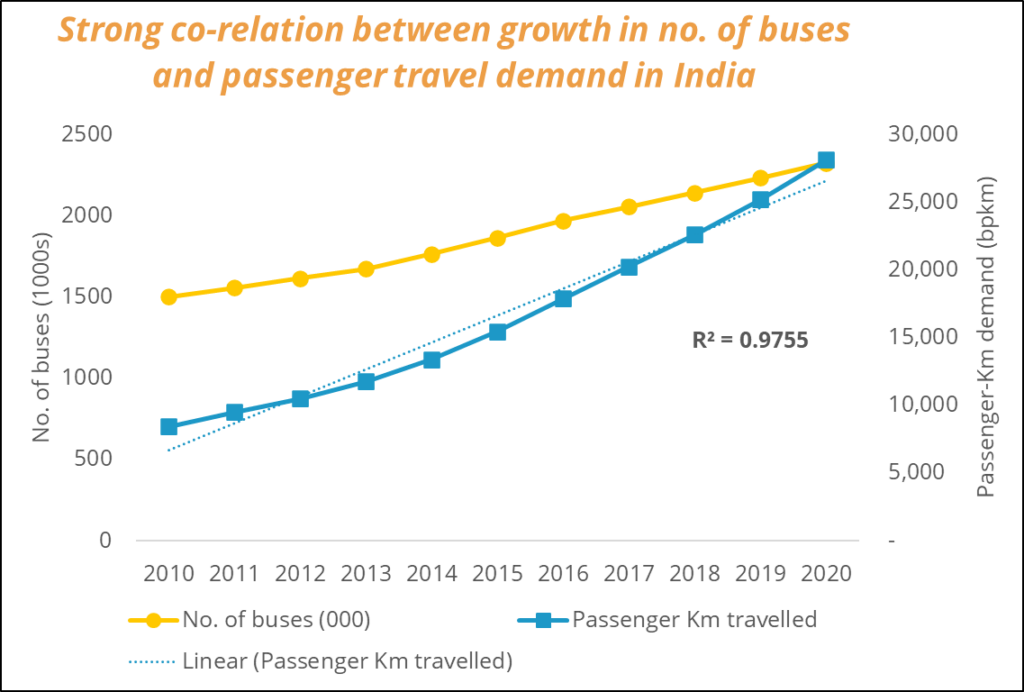
- Research by (IEA) and the (CTI) has shown that India has experienced consistent growth in travel demand over the past two decades due to rising population and economic activity.
- This trend is expected to persist until 2030, after which growth rates are anticipated to decline as the economy matures and emission mitigation measures to reduce travel take effect
- Based on the forecasts, we can conclude that the bus market will closely follow the growth in passenger travel demand, maintaining a similar rate of expansion throughout this decade before slowing after 2030.
- As per our analysis, the market is expected to grow annually by 5-7% from 2024 to 2030 due to increased travel demand, but the growth rate should slow to 3-5% after 2030 as the economy stabilizes.
E-bus market projections
The estimated sale of 56,000 e-buses by 2030 and 566,000 by 2030 in India reflects a significant growth trajectory for electric buses over the next decade.
Below chart presents the projected number e-bus sales in India between 2019 and 2030
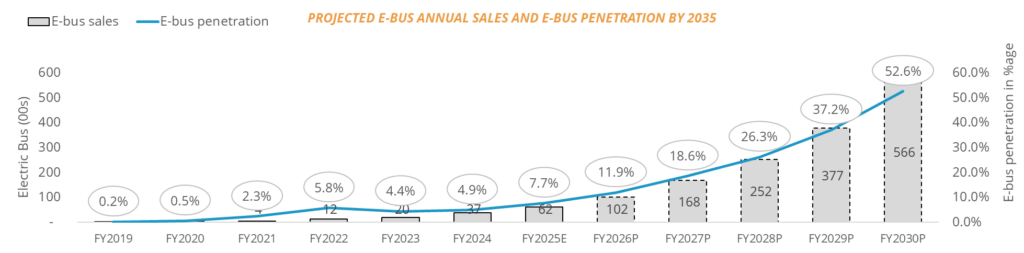
Projected Growth of E-Bus Fleet in India by 2030 based on growth projections and industry consultations
CAGR 2025-27 : 64-66%
The growth rate will be like that of CAGR 2022-24 ~ 65% due to effect of fame -3 subsidies and demand aggregation and launch of government tenders
CAGR 2028-30: 49-51%
The growth rate will taper of as effect of subsidies and demand aggregation fades away gradually
E-Bus Sales – Public vs Private assessment
The main reason for the private sector’s reluctance to transition is the significant initial expense of acquiring an e-bus.
An electric bus is four times more expensive than a diesel bus. However, for a profitable investment, its cost would need to be between 1.5 to 2 times that of a diesel bus.
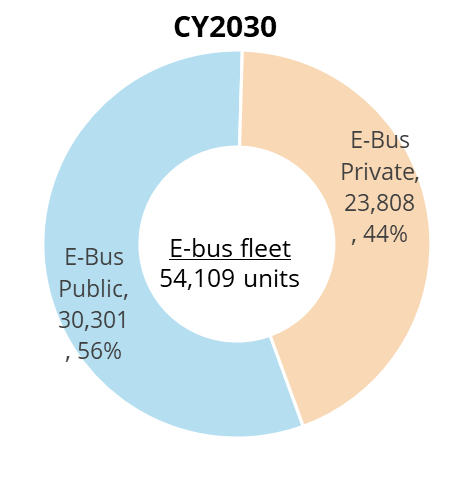
- Future Prospect : •We expect the share of private buses to increase from 10% to 55% over the next decade. This change will be driven by favourable total ownership costs and a decrease in capital expenses due to a global reduction in battery prices by up to 50%.
- •As EV adoption grows, OEMs will increase production, reducing the per-unit cost of e-buses due to economies of scale. This also enables OEMs to secure better prices for components and batteries, ultimately benefiting the entire e-bus ecosystem and driving electrification in the private sector •
- •In addition to the above points, the untapped potential for e-buses in non-urban areas is a key driver for the electrification of private buses. India currently has a negligible number of e-buses operating in non-urban areas, primarily served by private players. This presents a significant opportunity for the electrification of private bus fleets.
Definition on different types of Buses: As per Use case
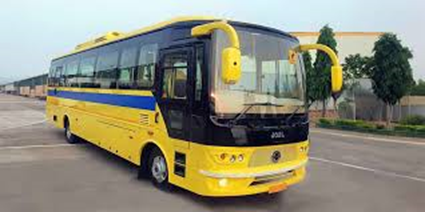
Type 1 buses
- Type 1 buses are buses which are generally used for intracity purposes •
- The Bus has standing, sitting, and storage space tailored made for short regular routes for passengers on a daily basis •
- These Buses can be of any length 7meter ,9meter or 12 meters depends on the geography and the routes defined for
Type 2 buses
- Type II buses are generally used for Mofussil purposes. •”Mofussil” refers to areas or regions located away from main cities or metropolitan centers •
- Type 2 buses serve various purposes, such as school buses or office staff transport.
- •These buses generally cover larger routes compared to Type 1 buses and cater to a wider area.
- •The length of Buses can also vary from particular use case and distance to be traveled.
Type 3 buses
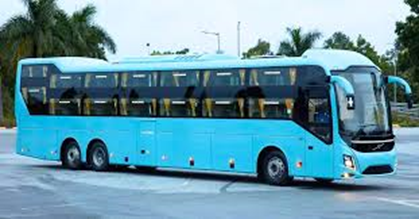
- Type III buses are typically used for intercity travel. •Type 3 buses do not have standing space inside; they are designed for longer journeys to ensure passenger comfort.
- •The average distance covered by Type III buses can be twice that of Type I routes.
- •The length of these Buses is normally 12 meters or plus with enough legroom meant for longer routes
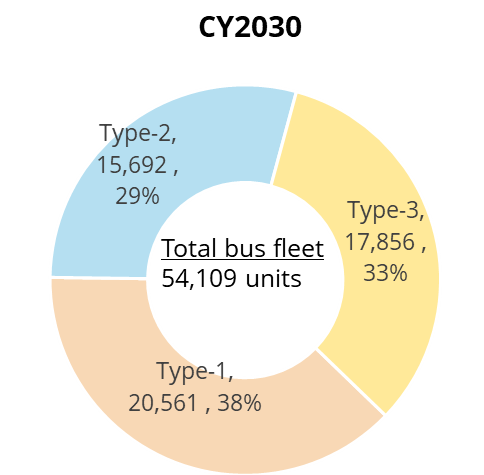
E-Bus fleet assessment based on Type of E-Buses
E- buses can be categorized into three types: 9-meter standard floor AC buses, and 12-meter low floor and standard floor non-AC and AC buses. Many cities prefer 9-meter buses due to their lower CAPEX costs and suitability for narrow streets.
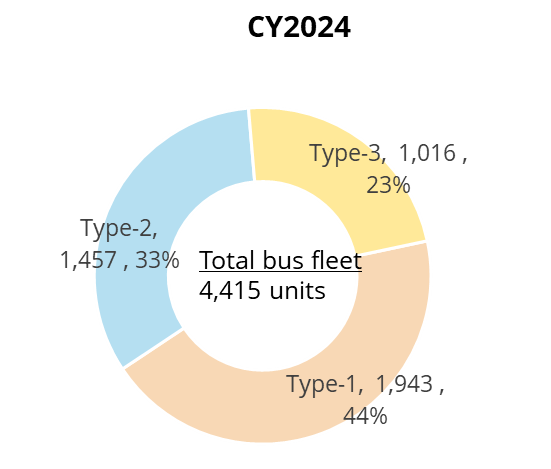
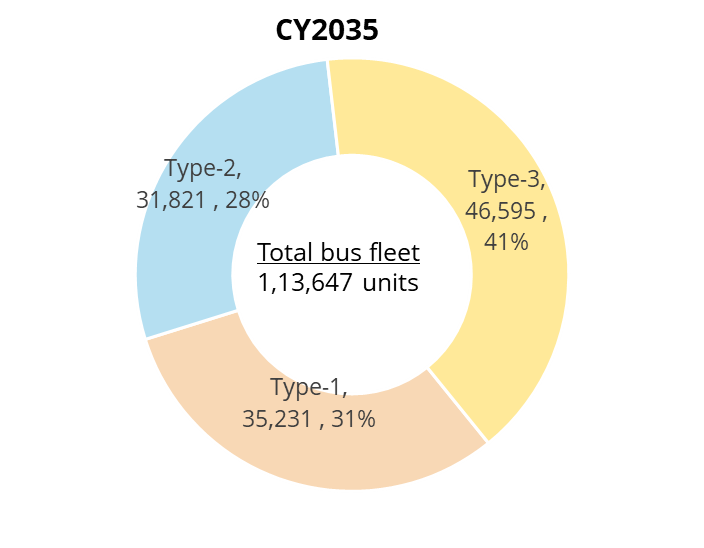
•CY2024 : The share of Type 1 buses is significant because they primarily serve the intra-city segment, which is seeing strong demand from government tenders. These tenders are also extending into tier 2 cities, where narrower lanes make the 9m Type 1 intra-city buses the ideal choice.
• •CY2030 : The development of a charging infrastructure ecosystem is expected to boost the inter-city Type 3 bus segment. With increased participation from private players, the share of the Type 3 segment will further grow. However, Type 2 buses catering to schools and staff will see limited uptake, as private entities like schools, offices, and universities will not find it economically feasible to opt for E-buses. •
•CY2035 :The Type-3 intercity segment is expected to surpass the Type-1 and Type-2 intra-city segments, especially with increased participation from private players and the growing electrification of e-buses.
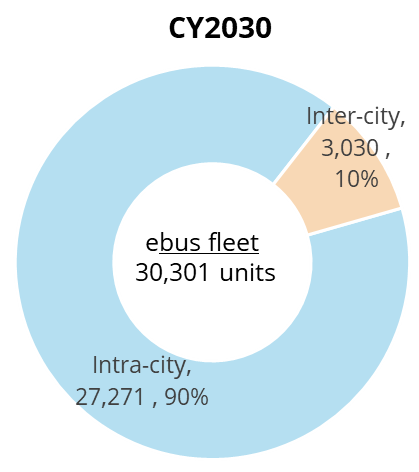
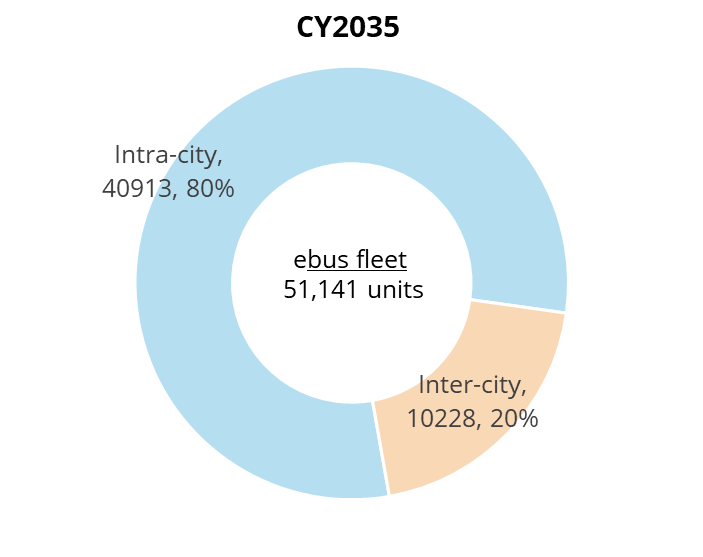
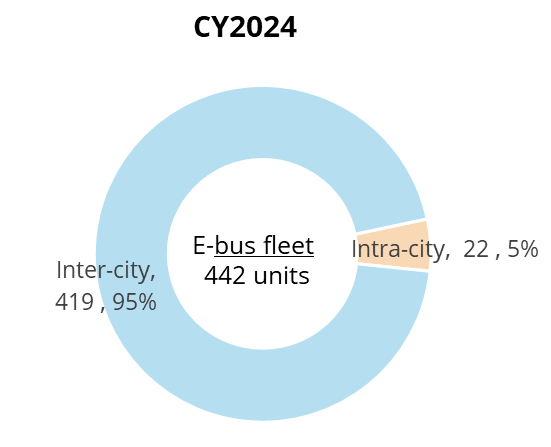
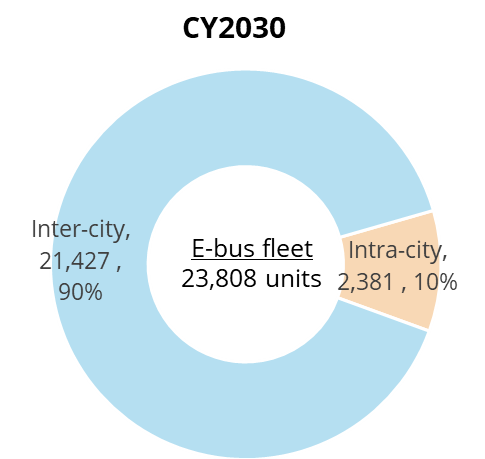
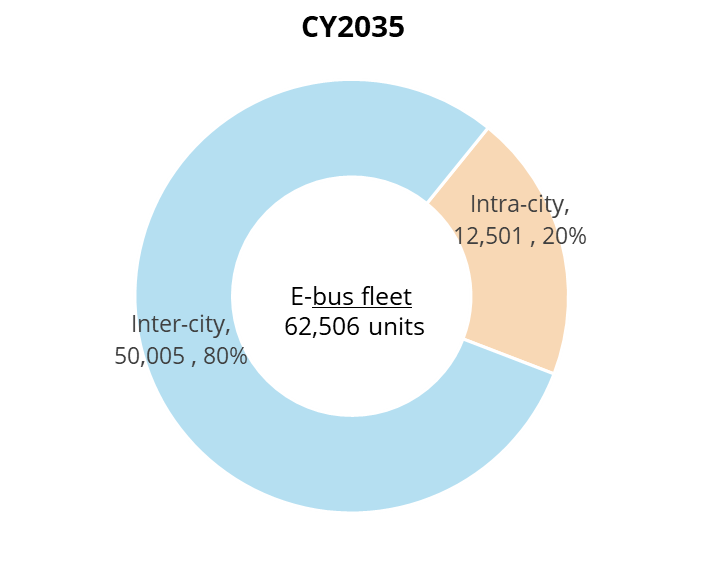
E-bus(public) – Intra-city vs Inter-city fleet assessment
Efforts to adopt e-buses in India by the government have primarily concentrated on intra-city urban bus services. This focus is due to the lower daily-kilometre (km) usage compared to intercity buses, making it easier to address range limitations issues
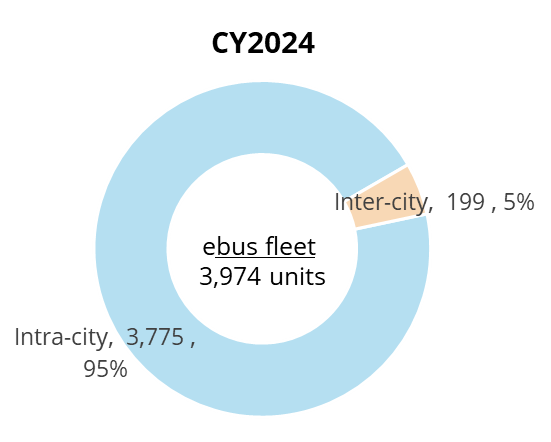
- CY2024 : The market share is predominantly held by intra-city buses, driven by government efforts to procure more of these buses, primarily due to range limitations that affect inter-city buses.
- •CY2030 : Intercity buses will be deployed in metro-cities with adequate charging infrastructure to make the deployment of e-buses feasible. Adequate charging infrastructure is expected to get developed in select highways and expressways connecting these cities . •
- •CY2035 : By 2035, the intercity services is expected to spread across non-urban areas, driven by enhancement in overall range of e-buses led by improvement in battery capacity, reduction in battery sizes and development of a robust charging infrastructure ecosystem
E-bus(private) – Intra-city vs Inter-city fleet assessment
The importance of electrifying private bus fleets lies in their predominant role in serving intercity and non-urban routes. Non-urban bus operations, which make up 88% of all stage carriage bus services, cater to over 150 million daily passenger trips
- •CY2024: Inter-city buses are dominating in private segment demand thanks to central government exemption and initiatives
- •CY2030: The inter-city segment is anticipated to grow, fueled by Govt. policies and advancements in opportunity charging infrastructure. In the intra-state sector, e-bus adoption will be led by a few big players in institutions, such as schools, offices, and universities, seeking to boost their brand reputation. • •
- CY2035: The intercity market is expected to mature with advancements in battery technology, price reductions, and improved charging infrastructure. Meanwhile, in the intra-city sector, private players anticipate adoption to rise in smaller cities and towns, particularly within institutions such as schools, offices, and universities.
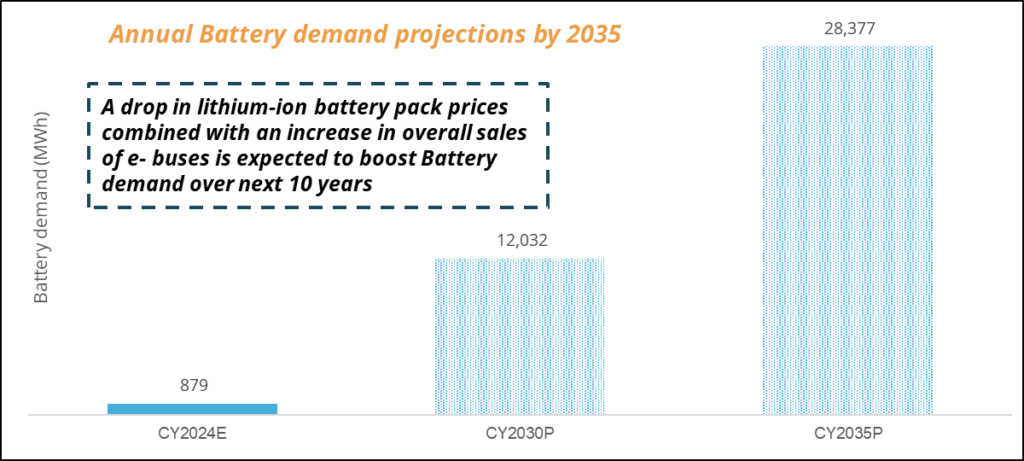
Battery Demand Projections
Battery demand assessment from E-bus segment in India
The demand for e-bus batteries in India is set to grow significantly, driven by advancements in technology, increased adoption of electric buses, and supportive government policies.
| Average Battery Size (kWh) | Up to 2024 | 2025-2030 | 2031-2035 |
|
9
metre Bus | 160 | 180 | 200 |
| 12 metre Bus | 250 | 270 | 300 |
| Other length buses (7m buses) | 100 | 100 | 120 |
- Key Drivers of Battery Demand •Infrastructure Development such as Charging Stations:
- The expansion of charging infrastructure, including fast-charging and opportunity charging stations, will support increased battery demand by enabling more frequent and convenient recharging. •
- •Range and Efficiency: Longer routes and higher passenger capacities require larger batteries to ensure sufficient range and operational efficiency. This drives the demand for advanced battery technologies. •
- Economic Factors such as Cost Reductions: Decreasing battery costs due to technological advancements and economies of scale will make larger capacities more affordable and drive higher demand.
Impact of Technological Advances on Battery Capacity based on bus segment
Over the next 10 years, we can expect an increase in average battery sizes, improved cost economics, and optimized battery management, leading to more widespread use of e-buses for both urban and intercity travel.
By 2035, Larger batteries and opportunity charging will boost the efficiency and range of e-buses in India
| Average Battery Size (kWh) | 2024 | 2030 | 2035 |
|
Public
sector STU e-buses (Mostly Intra-city) | 160 | 180 | 200 |
| Private sector e-buses (Mostly Inter-city) | 250 | 270 | 300 |
Current State : An analysis of the latest tender details reveals the average battery size for e-buses in India. A 9-meter bus, primarily used for intra-city routes in the public sector, has an average battery size of approximately 160 kWh. In contrast, a 12-meter bus, utilized for inter-city travel in the private sector, typically requires at least 250 kWh
Future Prospects (Next 10 Years)
- •Technological Improvements: Advances in battery technology, such as higher energy densities and improved battery management systems, will allow for more efficient and cost-effective batteries. This can lead to a reduction in the overall cost per kWh, making larger batteries more economically viable.
- •Cost Economics: The reduction in battery costs will encourage the adoption of larger batteries in e-buses, iwhch can increase the range and operational efficiency. Larger batteries will reduce the frequency of charging stops, making e-buses more practical for longer routes. •
- Battery Size : With ongoing technological advancements, the average battery size for e-buses may increase to improve range and reduce charging frequency. For instance, the battery capacity for a 9-meter bus could rise to around 200 kWh by 2035 , and for a 12-meter bus, it could increase to around 300 kWh or more by 2035
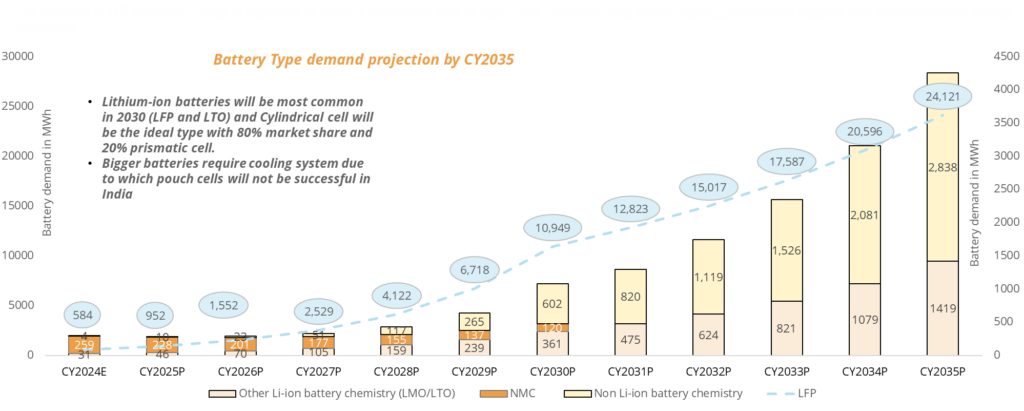
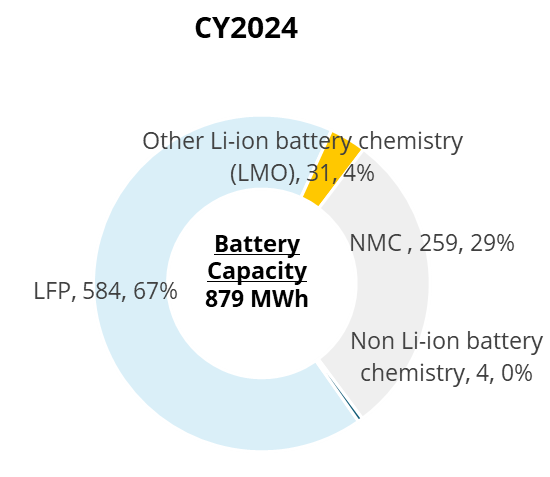
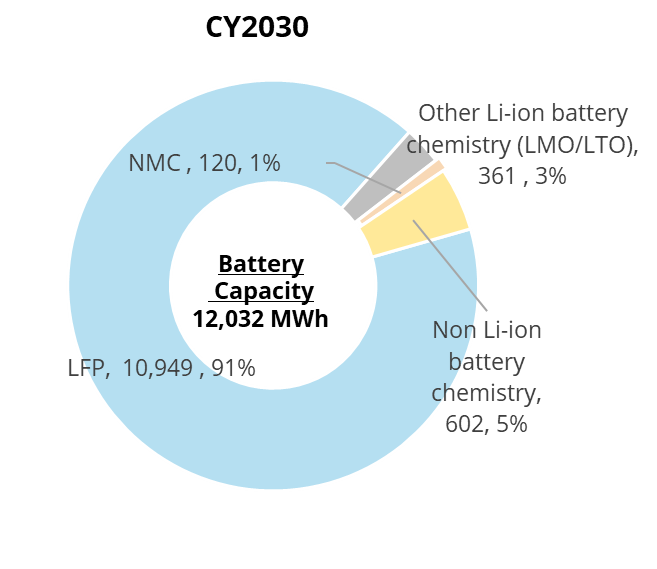
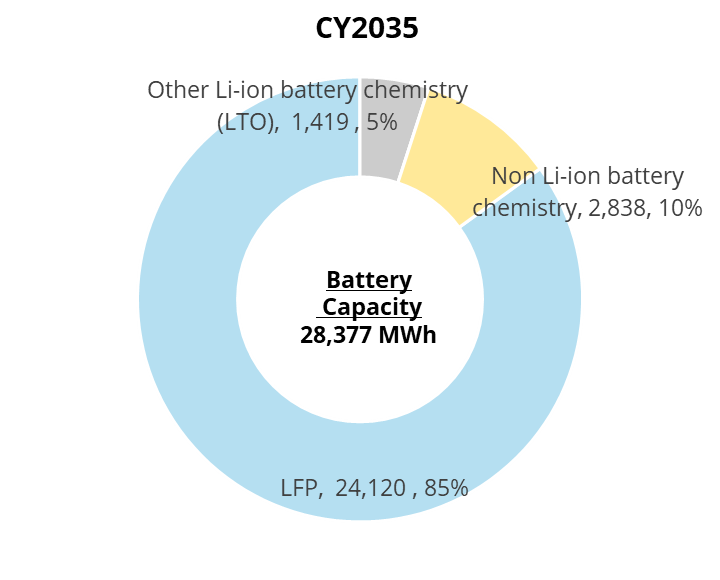
Battery Chemistry projections for E-bus segment in India
Currently, LFP batteries are preferred over NMC batteries, with a ratio of 70:30. The share of NMC batteries is expected to gradually decrease year-on-year over the next six years, becoming negligible after 2030.
The increase in LFP chemistry usage is expected as various companies plan to open local manufacturing plants, eyeing government support and standardization among industries.
Dominance of LFP Battery Chemistry : Advantages over NMC
LFP battery chemistry is projected to be the predominant battery type by CY2030 due to its superior thermal stability, lower cost, higher life cycles, and safety compared to NMC batteries.
- •LFP batteries have superior thermal stability and can withstand more charge and discharge cycles without significant degradation of capacity is ideal when considering India’s high temperatures in various states and high passenger demand.
- •Other than LFP and NMC, there are a few emerging battery technologies that are gaining traction in India. Some of them are Lithium cobalt oxide (LCO), Lithium Titanate (LTO), Lithium Manganese Oxide (LMO), and lithium manganese iron phosphate (LMFP), etc.
- •Other battery chemistries, such as solid-state batteries, are anticipated to grow at a CAGR of 127% by CY2030.
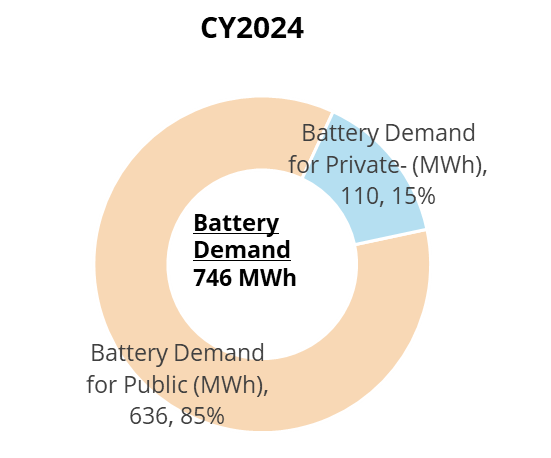
Annual Shift in Battery Consumption: Public vs. Private Sector in E-Buses
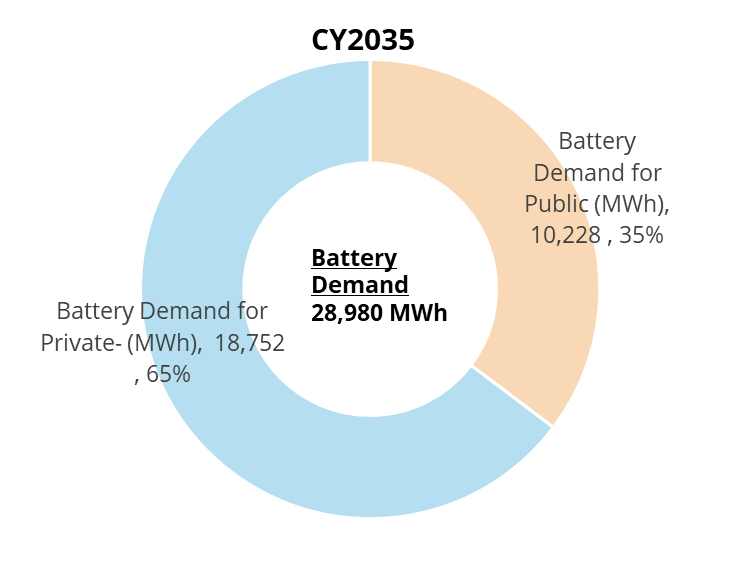
Currently, battery demand from the public sector is about seven times higher than from the private sector. However, as the charging infrastructure ecosystem develops, future demand will be driven by private players.
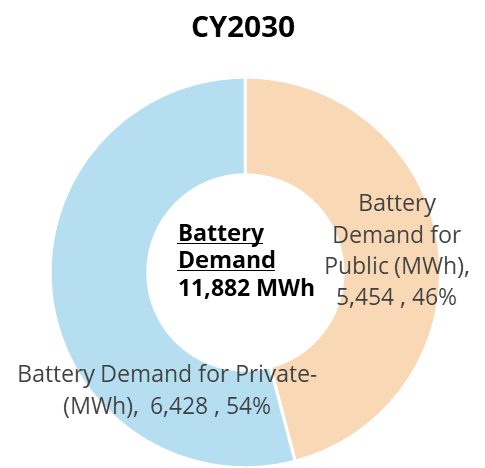
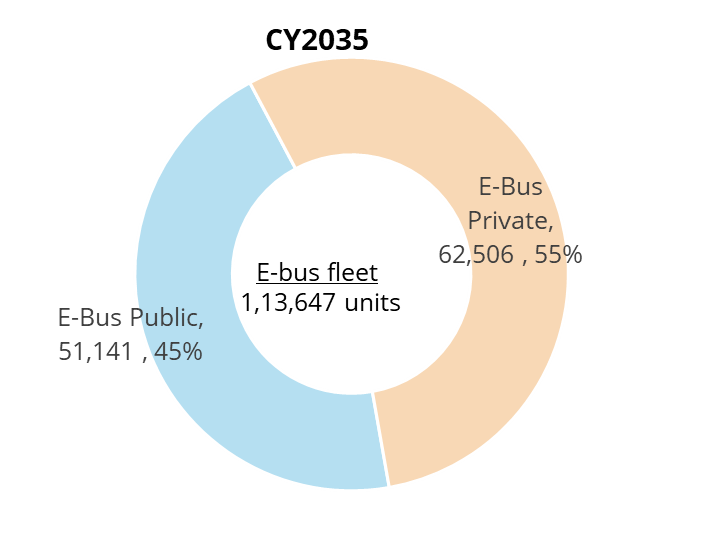
By 2030, battery demand from the private sector will surpass that of the public sector. This will occur despite private e-bus sales being estimated at only 44% of the total e-bus demand, due to their greater involvement in the inter-city segment.
- •CY24 : Battery demand is led by public players driven by their higher adoption, favourable incentives and a strong participation in the tender processes
- •CY30 : Battery demand from private sector will outpace the demand from public sector, with increasing sales demand and electrification of private segment led by retro fitment of 550,000 diesel buses to electric one over the next 5 years
- CY35 : As India reaches a maturity stage, battery demand will be driven by the private sector. The increased supply of e-buses in non-urban areas for intercity travel, primarily met by private players, will contribute to this trend. Consequently, private sector e-bus sales will further narrow the gap with the public segment
Annual Battery Capacity Requirements Based on Bus Length
Shorter buses used in urban environments typically require smaller batteries, while longer buses used for inter-city and long-distance travel need larger capacities.
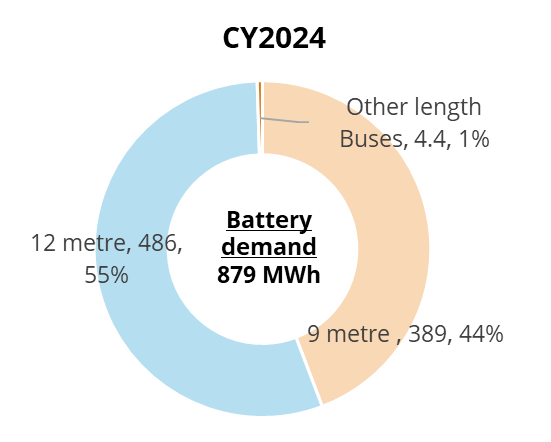
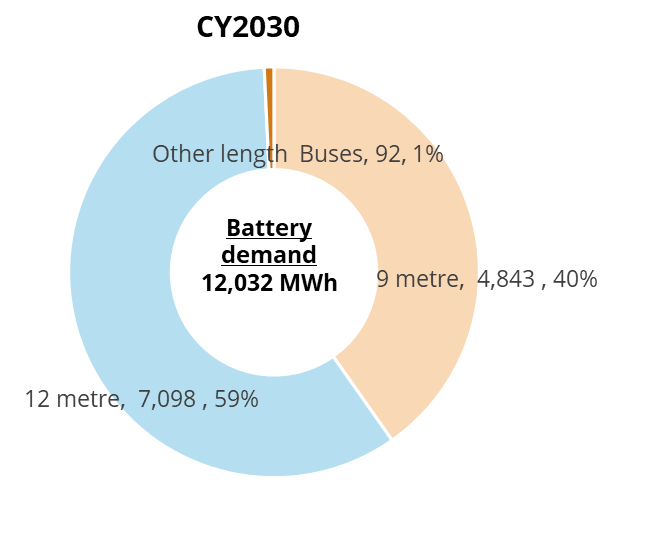
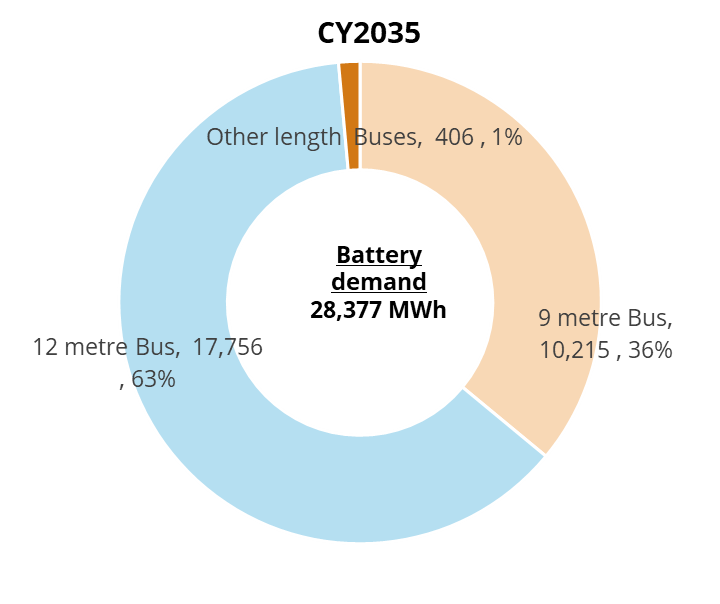
Assessing battery demand based on the length of the bus involves understanding the specific operational needs of each bus type.
- The average battery capacity used in 12-meter buses is expected to increase from 250 kWh to 270 kWh by CY2025 due to few state demands and the rise of private players in intercity routes like in Delhi
- As charging infrastructure improves and price parity between E-Bus and diesel buses becomes possible, private operator adoption is anticipated to rise significantly, especially for intercity routes. This will likely increase the average battery capacity in 12-meter buses to 280 kWh by CY2030.
- Additionally, the 13.5-meter bus category will enhance battery capacity to 280 kWh for private intercity routes, with high adoption expected in the next 3 years due to technological advancements.
- The current average battery size in 9-meter buses is around 160 kWh, which is estimated to increase to 180 kWh by CY2025 due to state demands for intracity purposes, and the rise of 9-meter AC buses and longer routes within states will increase the average to 200 kWh by CY2030.
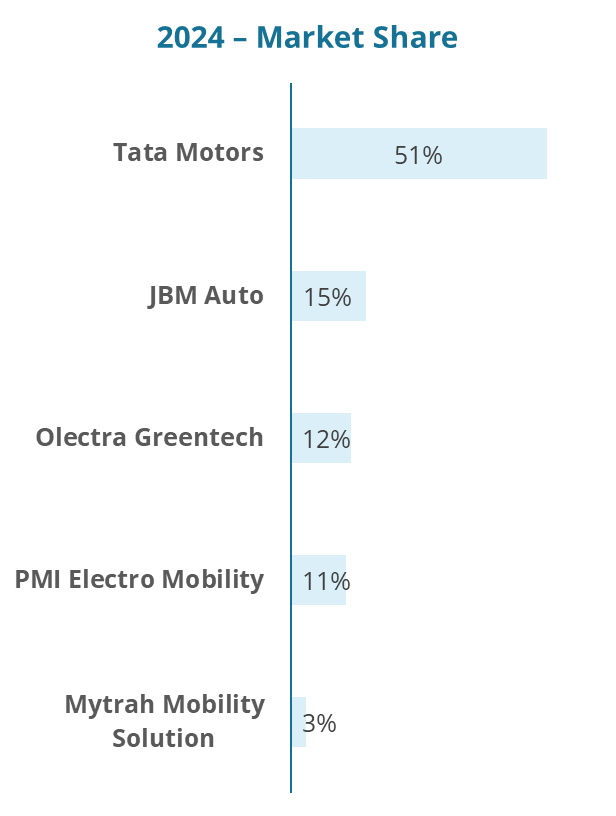
Key players
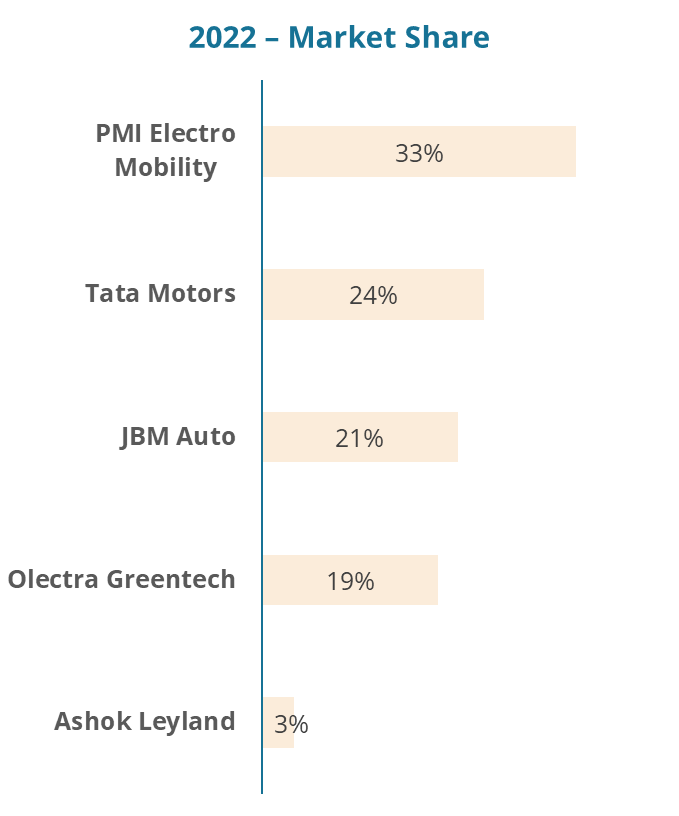
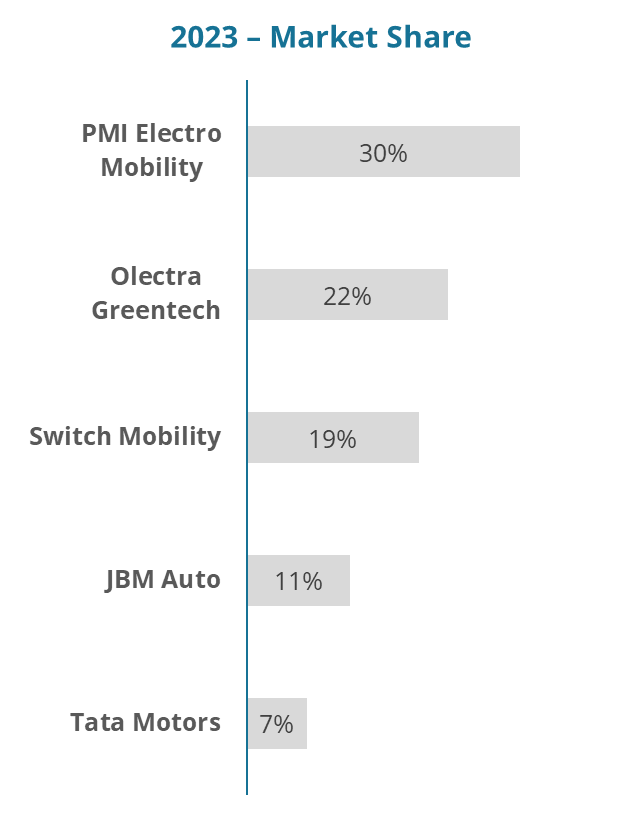
Market Share Trends : Small Electric E-Bus Manufacturers Are Thriving
Small electric bus manufacturers like Olectra Greentech and PMI Electro-mobility experienced a surge in orders and were able to capture the market share as larger firms avoided state transport tenders due to concerns over payment uncertainty
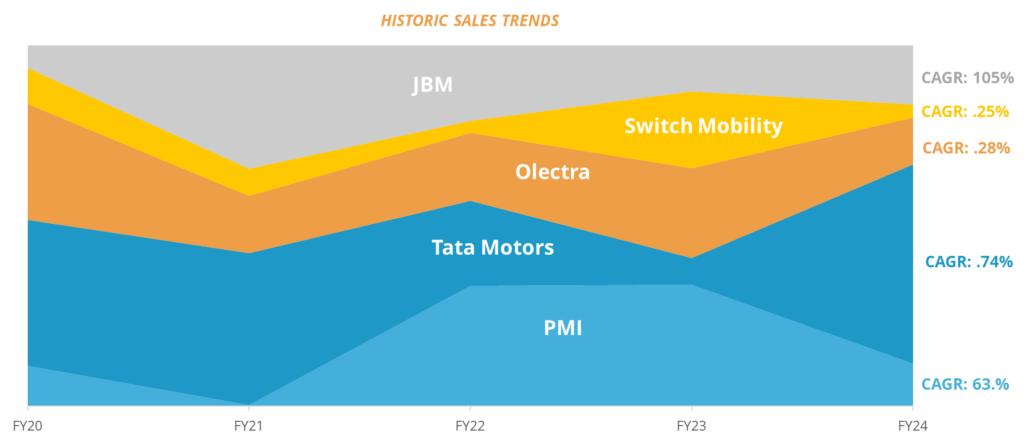
Historic Sales Trends – JBM leads with a superior sales growth
JBM has been expanding rapidly in recent years, significantly outpacing its competitors. Tata Motors, with a 74% CAGR, is also demonstrating strong growth.
Key Players in Driving Electric Bus Adoption in India: Leveraging Government tenders for Sustainable Urban Mobility
These companies have been crucial in driving the adoption of electric buses in India, leveraging government schemes and programs to expand their market presence and contribute to sustainable urban mobility
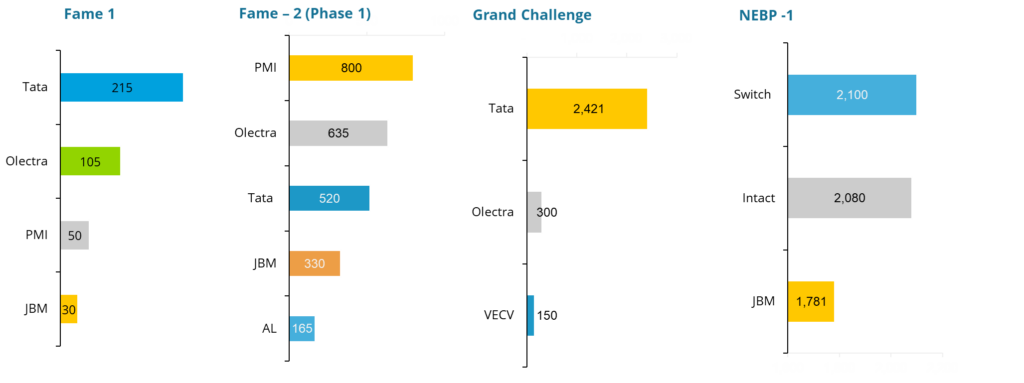
In addition to the above tenders, JBM has won the contract to operate 1,390 electric buses under the PM-eBus Sewa Scheme
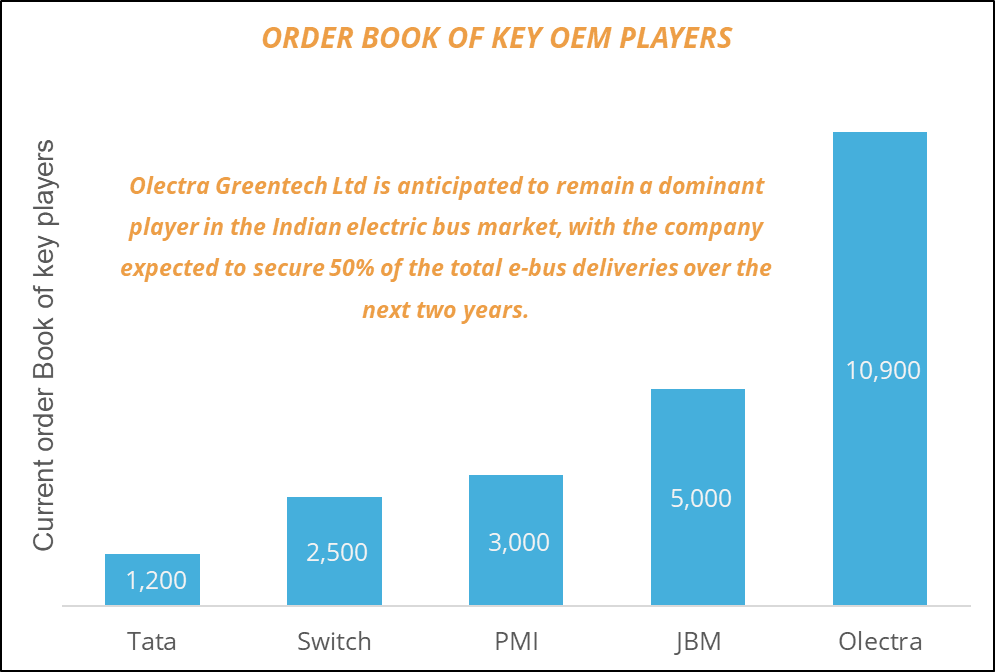
E-Bus Order Book to surpass 20,000 order amidst anticipation for Payment Security Mechanism
As the likelihood of implementing a payment security mechanism for electric buses improves, the order book for battery-powered buses is anticipated to grow significantly. This growth will be fueled by the increased participation of various players bidding for e-bus tenders in the coming months.
The Indian electric bus market is experiencing substantial growth, evidenced by a robust order book of over 20,000 electric buses slated for delivery within the next 24 months.
Demand for Payment security mechanism
- Implementing a payment security mechanism (PSM) would mitigate counterparty risk and enhance the bankability of projects, offering crucial balance sheet flexibility to OEMs and operators and potentially improving the prices contracted under GCC.
- This measure is likely to attract new developers and investors to e-bus concessions, thereby increasing opportunities for equity release for developers.
- The government’s forthcoming bids for e-bus concessions are anticipated to benefit from various PSMs, including a payment security fund, direct debt mechanism from state government accounts, and state guarantees for payment.
Business Model
Outright Purchase Model
The outright purchase model is a procurement method where an entity, such as a government agency or a private company, buys a product or service directly from the seller without any leasing or financing arrangements. In the context of e-bus, the model involves the buyer paying the full price of the electric buses upfront in exchange for ownership of the vehicles.
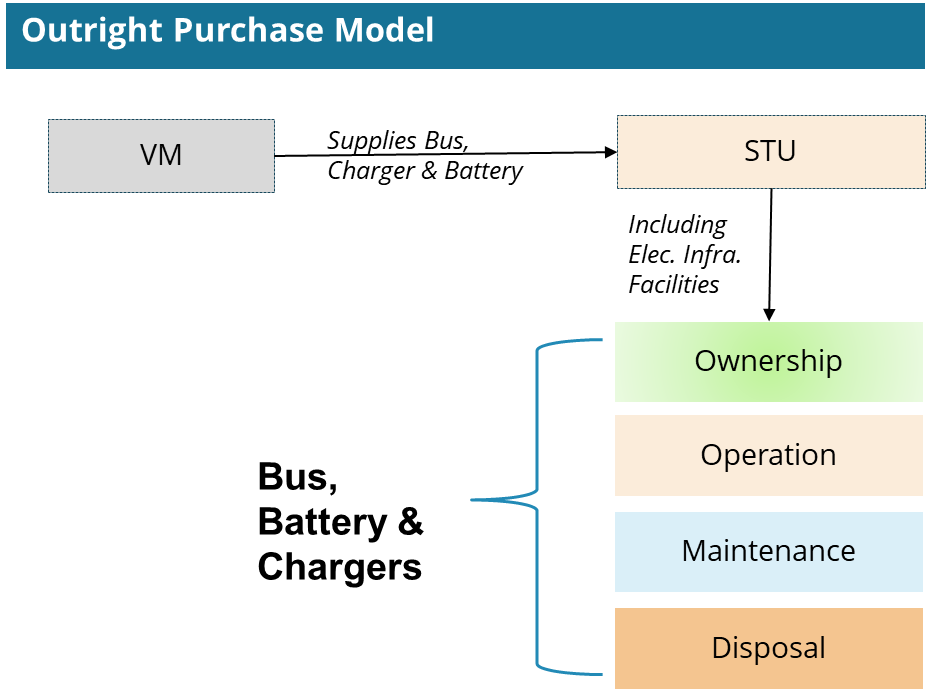
- The vehicle manufacturers provided the buses, batteries, and chargers to the State Transport Unit (STU), which procured them and managed ownership, operation, and maintenance internally.
- Implemented in select cities such as Kolkata, Indore, Jaipur, Guwahati, and Jammu during FAME I.
- Faced numerous challenges during deployment and operations.
- The outright purchase model provides several advantages, including complete ownership of the asset from the beginning, potential cost savings over the long term compared to leasing or financing arrangements, and greater flexibility in terms of customization and utilization of the assets.
Gross Cost Contract
Gross Cost Contract model allows the contracting entity to leverage the expertise and resources of the contractor while ensuring accountability and cost control throughout the project lifecycle.
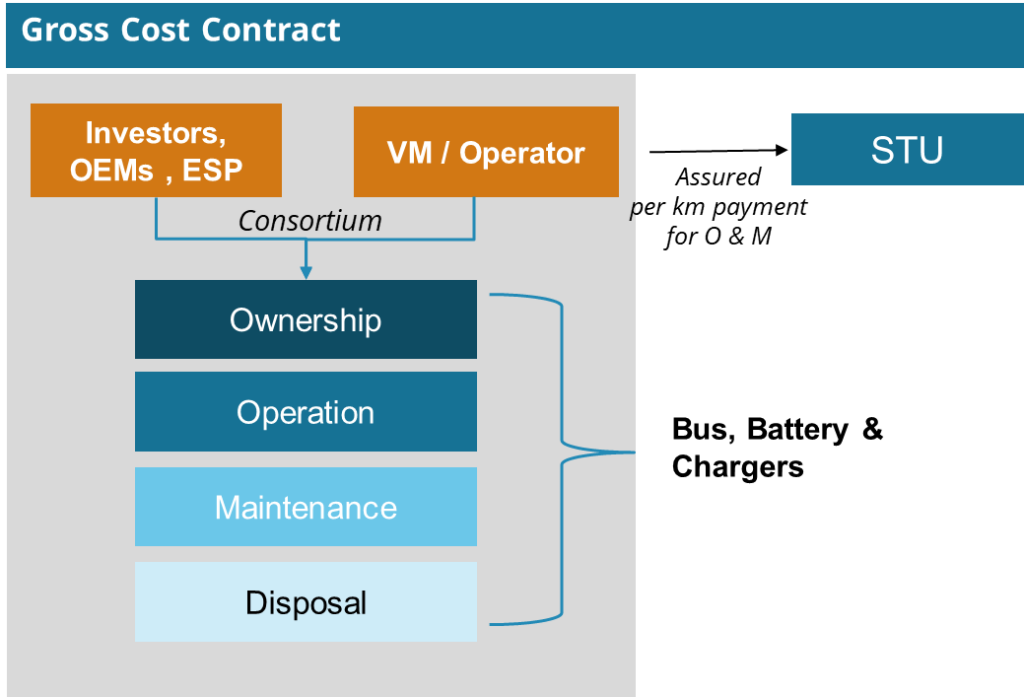
The major concern with this model is the potential for higher overall costs, as the contracting entity bears the responsibility for reimbursing all project expenses, including unforeseen or inflated costs.
- The vehicle manufacturer is responsible for the ownership, operation, and maintenance of the buses, batteries, and charging infrastructure.
- In return, they receive a predetermined compensation from the State Transport Units (STUs) based on guaranteed kilometers traveled.
- By sharing project risks, such as cost overruns, with the contractor, the financial burden on the contracting entity is reduced.
Utility Provider Led Model
This model involves the utility provider owning and operating the e-buses, as well as coordinating with various stakeholders such as transportation authorities and private operators. The utility provider may engage in partnerships or contracts with e-bus manufacturers and service providers for the acquisition, operation, and maintenance.
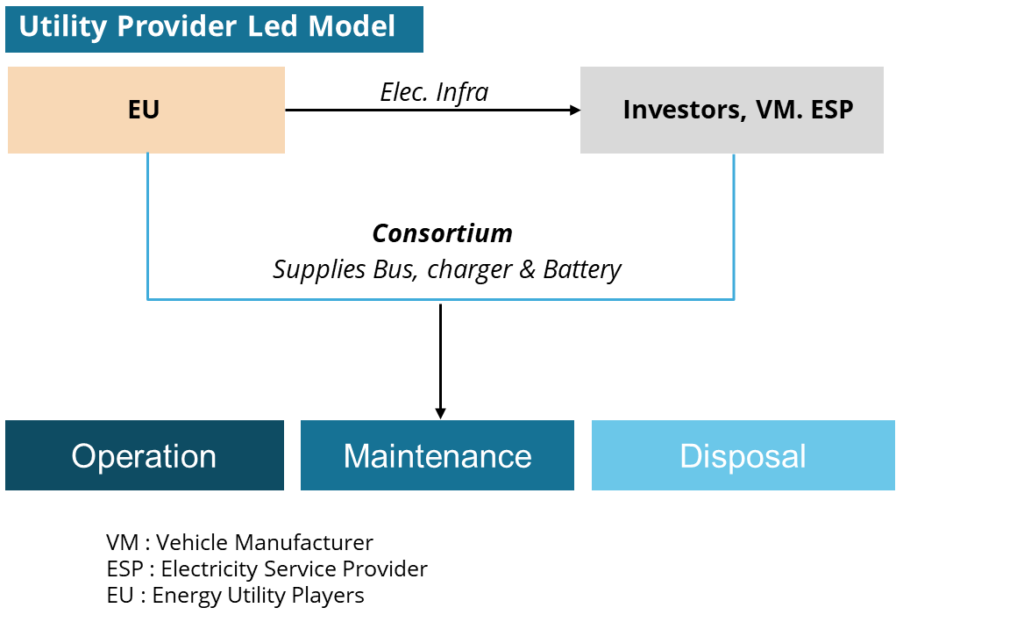
- The energy utility company, as the primary stakeholder, possesses the services and engages in contracts with private entities for the operation and maintenance.
- By partnering with private entities, the energy utility company leverages external expertise and resources while retaining overall control and oversight of the services provided.
CHARGING TECHNOLOGY
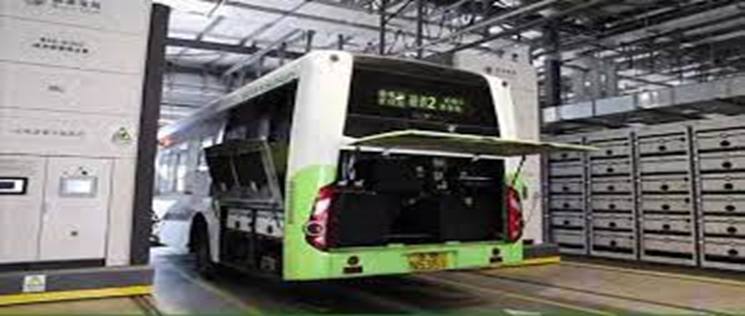
Battery Swapping
- Battery swapping entails replacing a bus’s depleted battery with a fully charged one. This approach addresses the significant drawback of extended in-depot time during the charging of plug-in battery buses.
- As a result, the reduced in-depot time becomes comparable to the refueling time of diesel/CNG buses. However, this advantage comes with a trade-off: a reduced range, as smaller and lighter batteries are necessary to conveniently swap.
- This added cost diminishes its attractiveness for adoption. Ahmedabad is the only Indian city that has initiated pilot projects involving buses equipped with battery-swapping technology. Ahmedabad undertaken a trial of battery swapping technology with 18 e-buses in collaboration with Ashok Leyland as the bus OEM and Sun Mobility as the energy service provide
Inductive Charging
- Inductive charging involves transferring energy from one surface to another without direct contact, commonly known as wireless charging in electric vehicles.
- The minimum output voltage for inductive charging is 415 V. While inductive charging requires minimal space for the charger itself, it necessitates additional infrastructure. •
- However, due to the high cost of such equipment, inductive charging has not been widely adopted in India thus far
Conductive Charging
- Electricity transfer via conduction necessitates direct contact between two surfaces.
- Therefore, conductive charging predominantly relies on plugs that must be connected to an electric vehicle. •
- The two most employed methods for charging electric buses using conductive chargers are depot charging and opportunity charging.
Regenerative Braking
- Regenerative braking is a process wherein energy generated during braking is utilized to recharge the batteries within electric buses.
- Unlike conventional braking systems that rely on brake pads producing friction with brake rotors to slow down the vehicle, regenerative braking minimizes energy loss.
Conductive Charging – Type of Chargers
Conductive charging uses direct contact between the EV connector and charge inlet
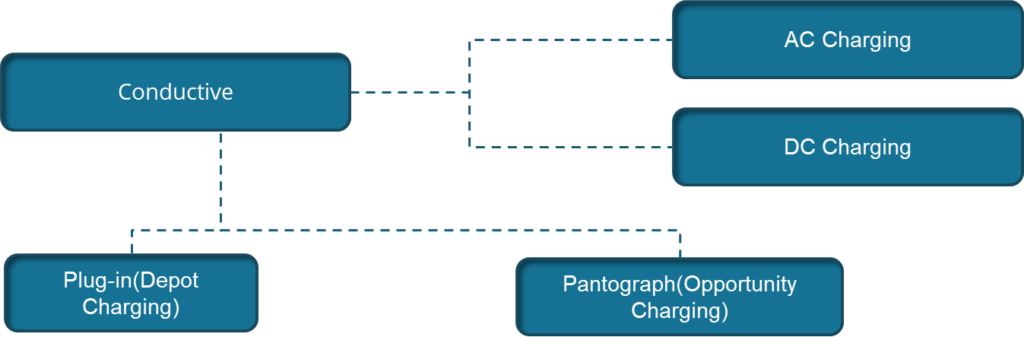
Conductive charging is the leading technology used for charging infrastructure in India is favored for its design simplicity and lower infrastructure costs
Conductive Charging – Plug-in Charging Technology
AC charging is primarily used for overnight depot charging due to its simplicity and cost-effectiveness, while DC charging is employed for fast and opportunity charging, offering quick top-ups and supporting high-frequency bus operations.
| Power | Classification basis | Type of AC/DC charging | Used in e-Bus charging? (Y/N) |
| AC | Service Voltage level | AC level 1 (120 V) | N |
| AC level 2 (230 V) | N | ||
| AC level 3 (415 V) | Y – requires e-Buses to have on-board chargers More economical, Higher charging time | ||
| DC | Charging system design | DC Plug-in (415V) | Y- doesn’t require e-Buses to have on-board chargers Expensive, Low charging time |
| DC Pantograph | N |
In two to three hours, a 150-kW battery can be fully charged via DC charging. However, A battery with a similar capacity would require four to five hours to charge via AC charging
Conductive Charging – Major Methods of Conductive Charging
Plug-in charging is simpler and more cost-effective for long-duration charging, while pantograph charging offers rapid, efficient top-ups suitable for high-frequency routes. By integrating both methods, transit agencies can maximize efficiency, reduce operational costs, and ensure a reliable and flexible electric bus service.
Plug-in Charging (Existing Model)
- Plug-in charging is the prevalent technology for depot charging. Typically, it consists of two primary components: a Power Control System (PCS) and a charging dispenser. A single PCS can typically accommodate up to ten charging dispensers, each of which can charge up to two buses, depending on its size and capacity.
- Commonly Adopted Model:
- Straightforward Technology
- Lower Capital Cost Compared to Pantograph Compatible with Both Fast and Slow Charging
Pantograph Charging (Emerging Technology In India)
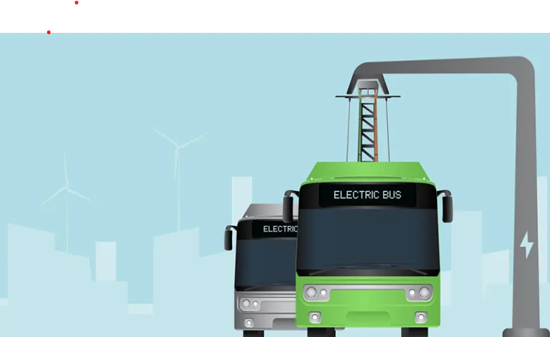
- Pantographs are typically affixed to poles at bus stops frequented by passengers. A pantograph lowers to link up with the bus roof for battery recharging. Alternatively, some configurations feature pantographs mounted on the bus roof, extending upwards to contact the pole. In the context of opportunity charging, these systems operate at terminal bus stops, where charging durations can span several minutes.
- Charging time is significantly shorter compared to plug-in charging (12-15 minutes for full charging).
- Prioritizes effective utilization of buses in terms of operational kilometers.
- Automated and requires less maintenance.
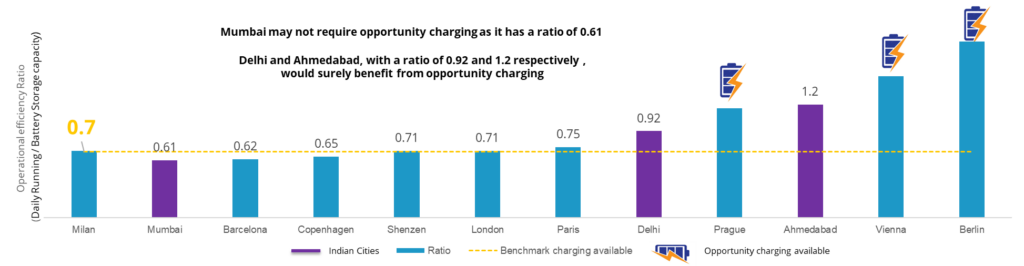
Need for Opportunity Charging in India
India heavily depends on overnight charging for E-bus, and for cities like Delhi and Ahmedabad it is proving inadequate to meet daily mileage demands. Therefore, it’s imperative to develop an opportunity charging infrastructure. These Cities will require sizable batteries and ample opportunity charging time to offer flexibility in scheduling their electric bus operations.
Opportunity charging becomes necessary when the daily running distance exceeds 0.7 times the battery storage capacity
- Indian cities have predominantly favored Plug-in charging for electric buses due to its widespread use and recognition worldwide. However, this technology poses several drawbacks.
- The significant daily operational distance required by buses in major cities necessitates large batteries, which, in turn, results in extended charging times ranging from 6-8 hours for Slow Charging and 2-3 Hours for Fast Charging.
- Additionally, Plug-in charging reduces passenger carrying capacity and increases vehicle weight. Reliance solely on overnight charging proves insufficient to meet daily mileage requirements, prompting the need for daytime opportunity charging, albeit at the expense of operational efficiency.
Ahmedabad battery Swapping Pilot project
Battery swapping is seen as a promising solution to enhance the adoption of electric buses in India. Instead of waiting for an electric bus to recharge its batteries, depleted batteries are quickly exchanged with fully charged ones, reducing the downtime of the vehicle. Despite its potential benefits, the Ahmedabad pilot project faced several challenges
Battery Swapping – Ahmedabad became home to India’s inaugural public bus battery-swapping station
- Ahmedabad Janmarg Limited (AJL) initiated a trial of battery swapping technology with 18 e-buses in collaboration with Ashok Leyland as the bus OEM and Sun Mobility as the energy service provider.
- The Swapping technology involved designing buses that can have their batteries swapped after a long trip
- •SUN Mobility provided and operated the ‘Quick Interchange Station’ (QIS), where buses stopped after a round-trip for battery swaps. The QIS automated the removal of drained batteries and replaced them with charged ones. This setup ensured consistent charging without sudden load surges.
- Smart batteries, which were a quarter of the weight of standard lithium-ion batteries, were swapped in under 2.5 minutes.
The pilot project did not achieve the anticipated success and faced obstacles in gaining nationwide acceptance
The Ahmedabad battery swapping pilot project faced several challenges that contributed to its failure
- Increased range anxiety stemmed from an operational range of only about 40 kilometers per swap.
- The high number of swaps per day reduced operational efficiency, with each swap taking approximately 3-5 minutes and compromising service levels.
- Coordinating the logistics of swapping batteries at different locations while ensuring that charged batteries were always available proved challenging. This led to downtime and reduced operational efficiency for the buses.
- Coordination between Ashok Leyland as the bus OEM and SUN Mobility as the energy service provider needed to be more cohesive

0 Comments